ADX Intelligent Trend Tracking Strategy

Author: ChaoZhang, Date: 2023-11-28 14:04:00
Tags:

img

Overview

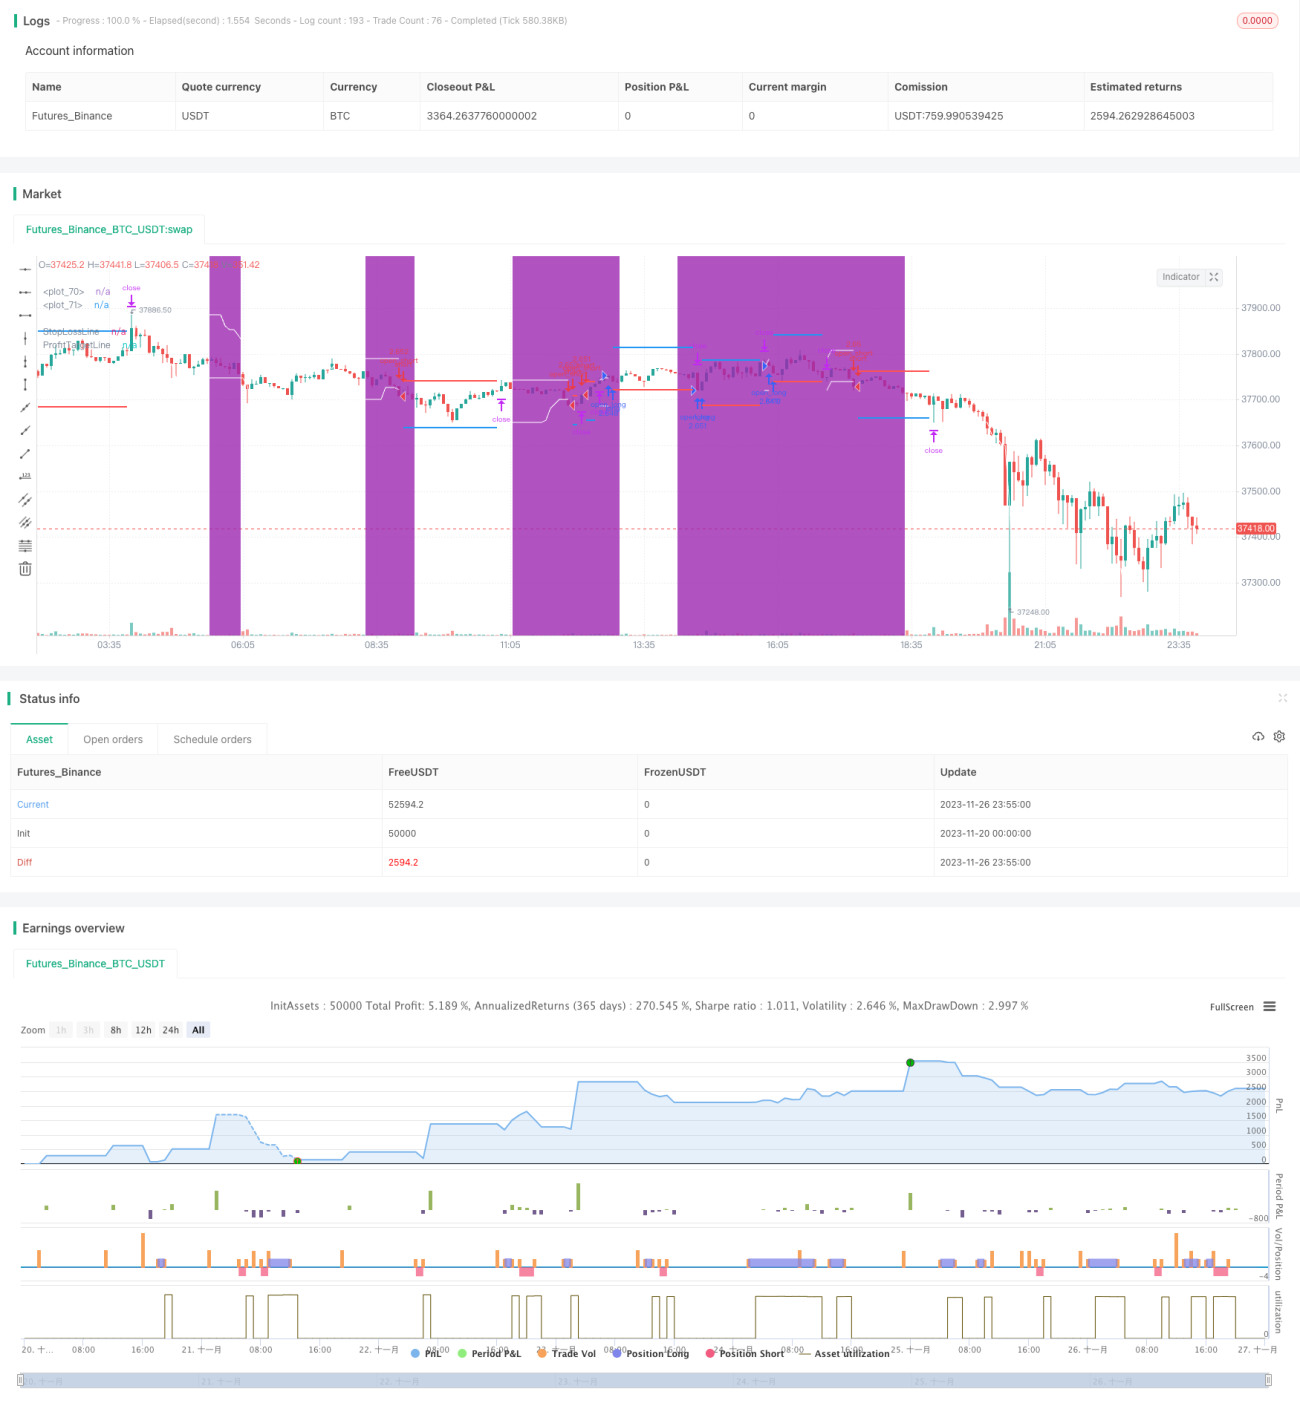
The ADX Intelligent Trend Tracking Strategy uses the Average Directional Index (ADX) to judge the strength of trends and capture trends when they are weak and follow strong trends for profit. The strategy generates trading signals by judging the strength of trends while combining price breakthroughs and belongs to a type of trend tracking strategy.

Strategy Principle

The core of this strategy is mainly based on the Average Directional Index (ADX) to judge the current trend strength. ADX calculates the average value of DIRECTIONAL INDICATOR of price fluctuations over a certain period to represent the strength of the trend. When the ADX value is below the set threshold, we believe the market is consolidating. At this time, the box range is determined. If the price breaks through the upper and lower rails of the box, a trading signal is generated.

Specifically, the strategy first calculates the 14-cycle ADX value. When it is lower than 18, it is considered that the trend is weaker. It then calculates the range of the box formed by the highest and lowest prices of the past 20 K-lines. When the price breaks through this box, buy and sell signals are generated. The stop loss distance is 50% of the box size, and the take profit distance is 100% of the box size.

This strategy combines trend strength judgment and breakthrough signals to capture trends when they are weaker and enter a consolidation, avoiding frequent trading in disorderly markets. And when a strong trend appears, the wider profit target can obtain more profits.

Advantages of the Strategy

  1. Combining trend strength judgment can avoid frequent trading in disorderly markets.
  2. Breakthrough of the box increases filtering to avoid being trapped in volatile markets.
  3. In trend markets, greater profit targets can be obtained.
  4. Customizable ADX parameters, box parameters, stop loss coefficients, etc. to adapt to different varieties.

Risks of the Strategy

  1. Improper ADX parameter settings may miss trends or make wrong judgments.
  2. Excessively large or small box ranges can affect results.
  3. Inappropriate stop loss and take profit coefficients may cause insufficient stop loss or too early profit taking.

Parameters like ADX, box range, stop loss coefficients can be optimized to make it more suitable for different products and market environments. At the same time, strict money management is also essential to control the proportion of single stop loss to avoid huge losses.

Directions for Strategy Optimization

  1. ADX Parameters can test results of different cycles.
  2. Box parameters can test different lengths to determine optimal range sizes.
  3. Fine-tune stop loss and take profit coefficients to optimize risk-return ratios.
  4. Test the effects of unilateral long/short trading only.
  5. Add other indicators for combos, like volume indicators.

Summary

The ADX Intelligent Trend Tracking Strategy is generally a relatively stable trend tracking strategy. It combines trend strength judgment and price breakthrough signals to avoid the issues like chasing highs and killing lows that are common in typical trend following strategies. Through parameter optimization and strict money management, the strategy can profit steadily.


/*backtest
start: 2023-11-20 00:00:00
end: 2023-11-27 00:00:00
period: 5m
basePeriod: 1m
exchanges: [{"eid":"Futures_Binance","currency":"BTC_USDT"}]
*/

//Developer: Andrew Palladino. 
//Creator: Rob Booker.
//Date: 9/29/2017
//@version=5
//Date: 08/10/2022
//Updated to V5 from V1, default cash settings added and indicators made more easily visible by:
// @ Powerscooter

strategy("Rob Booker - ADX Breakout", shorttitle="ADX Breakout V5", overlay=true, default_qty_type = strategy.cash, default_qty_value = 100000, initial_capital = 100000)

adxSmoothPeriod = input(14, title="ADX Smoothing Period", group = "ADX Settings")
adxPeriod = input(14, title="ADX Period", group = "ADX Settings")
adxLowerLevel = input(18, title="ADX Lower Level", group = "ADX Settings")
boxLookBack = input(20, title="BreakoutBox Lookback Period", group = "BreakoutBox")
profitTargetMultiple = input(1.0, title="Profit Target Box Width Multiple", group = "Take Profit and Stop Loss")
stopLossMultiple = input(0.5, title="Stop Loss Box Width Multiple", group = "Take Profit and Stop Loss")
enableDirection = input(0, title="Both(0), Long(1), Short(-1)", group = "Trade Direction")


// When the ADX drops below threshold limit, then we consider the pair in consolidation. 
// Set Box around highs and lows of the last 20 candles. with upper and lower boundaries. 
// When price breaks outside of box, a trade is taken. (on close or on touch?)
// Stop is placed, default 50%, of the size of the box. So if box is 200 pips, stop is at 100 pips. 
// Profit target is 100% of the size of the box. Default. User can set a profit target of 0.5, 1 full size, 2 or 3. 


dirmov(len) =>
	up = ta.change(high)
	down = -ta.change(low)
	truerange = ta.rma(ta.tr, len)
	plus = fixnan(100 * ta.rma(up > down and up > 0 ? up : 0, len) / truerange)
	minus = fixnan(100 * ta.rma(down > up and down > 0 ? down : 0, len) / truerange)
	[plus, minus]

adx(dilen, adxlen) => 
	[plus, minus] = dirmov(dilen)
	sum = plus + minus
	adx = 100 * ta.rma(math.abs(plus - minus) / (sum == 0 ? 1 : sum), adxlen)

adxHigh(dilen, adxlen) => 
	[plus, minus] = dirmov(dilen)
	plus
	
adxLow(dilen, adxlen) => 
	[plus, minus] = dirmov(dilen)
	minus
	
sig = adx(adxSmoothPeriod, adxPeriod)
//sigHigh = adxHigh(dilen, adxlen)
//sigLow = adxLow(dilen, adxlen)

isADXLow = sig < adxLowerLevel

//boxUpperLevel = ta.highest(high, boxLookBack)[1]
//boxLowerLevel = ta.lowest(low, boxLookBack)[1]

var float boxUpperLevelCarry = 0
var float boxLowerLevelCarry = 0

boxUpperLevel = strategy.position_size == 0 ? ta.highest(high, boxLookBack)[1] : boxUpperLevelCarry
boxUpperLevelCarry := boxUpperLevel
boxLowerLevel = strategy.position_size == 0 ? ta.lowest(low, boxLookBack)[1] : boxLowerLevelCarry
boxLowerLevelCarry := boxLowerLevel

boxWidth = boxUpperLevel - boxLowerLevel

profitTarget = strategy.position_size > 0  ? strategy.position_avg_price + profitTargetMultiple*boxWidth : strategy.position_size < 0 ?  strategy.position_avg_price - profitTargetMultiple*boxWidth : na
stopLoss = strategy.position_size > 0 ? strategy.position_avg_price - stopLossMultiple*boxWidth : strategy.position_size < 0 ? strategy.position_avg_price + stopLossMultiple*boxWidth : na

plot(strategy.position_size == 0 ? boxUpperLevel : na, color=color.white, style = plot.style_linebr)
plot(strategy.position_size == 0 ? boxLowerLevel : na, color=color.white, style = plot.style_linebr)


bgcolor(isADXLow ? color.purple : na, transp=72, title = "ADX limit")
plot(stopLoss, color=color.red, linewidth=2, style = plot.style_linebr, title="StopLossLine")
plot(profitTarget, color=color.blue, linewidth=2, style = plot.style_linebr, title="ProfitTargetLine")

isBuyValid = strategy.position_size == 0 and ta.cross(close, boxUpperLevel) and isADXLow

//Long Entry Condition
strategy.exit("close_long", from_entry="open_long", limit = profitTarget, stop = stopLoss)
if isBuyValid and strategy.opentrades == 0 and (enableDirection == -1 or enableDirection == 0)
    strategy.entry("open_long", strategy.long)

isSellValid = strategy.position_size == 0 and ta.cross(close, boxLowerLevel) and isADXLow

//Short Entry condition
strategy.exit(id="close_short", from_entry="open_short", limit = profitTarget, stop = stopLoss)
if isSellValid and strategy.opentrades == 0 and (enableDirection == 1 or enableDirection == 0)
    strategy.entry("open_short", strategy.short)

More