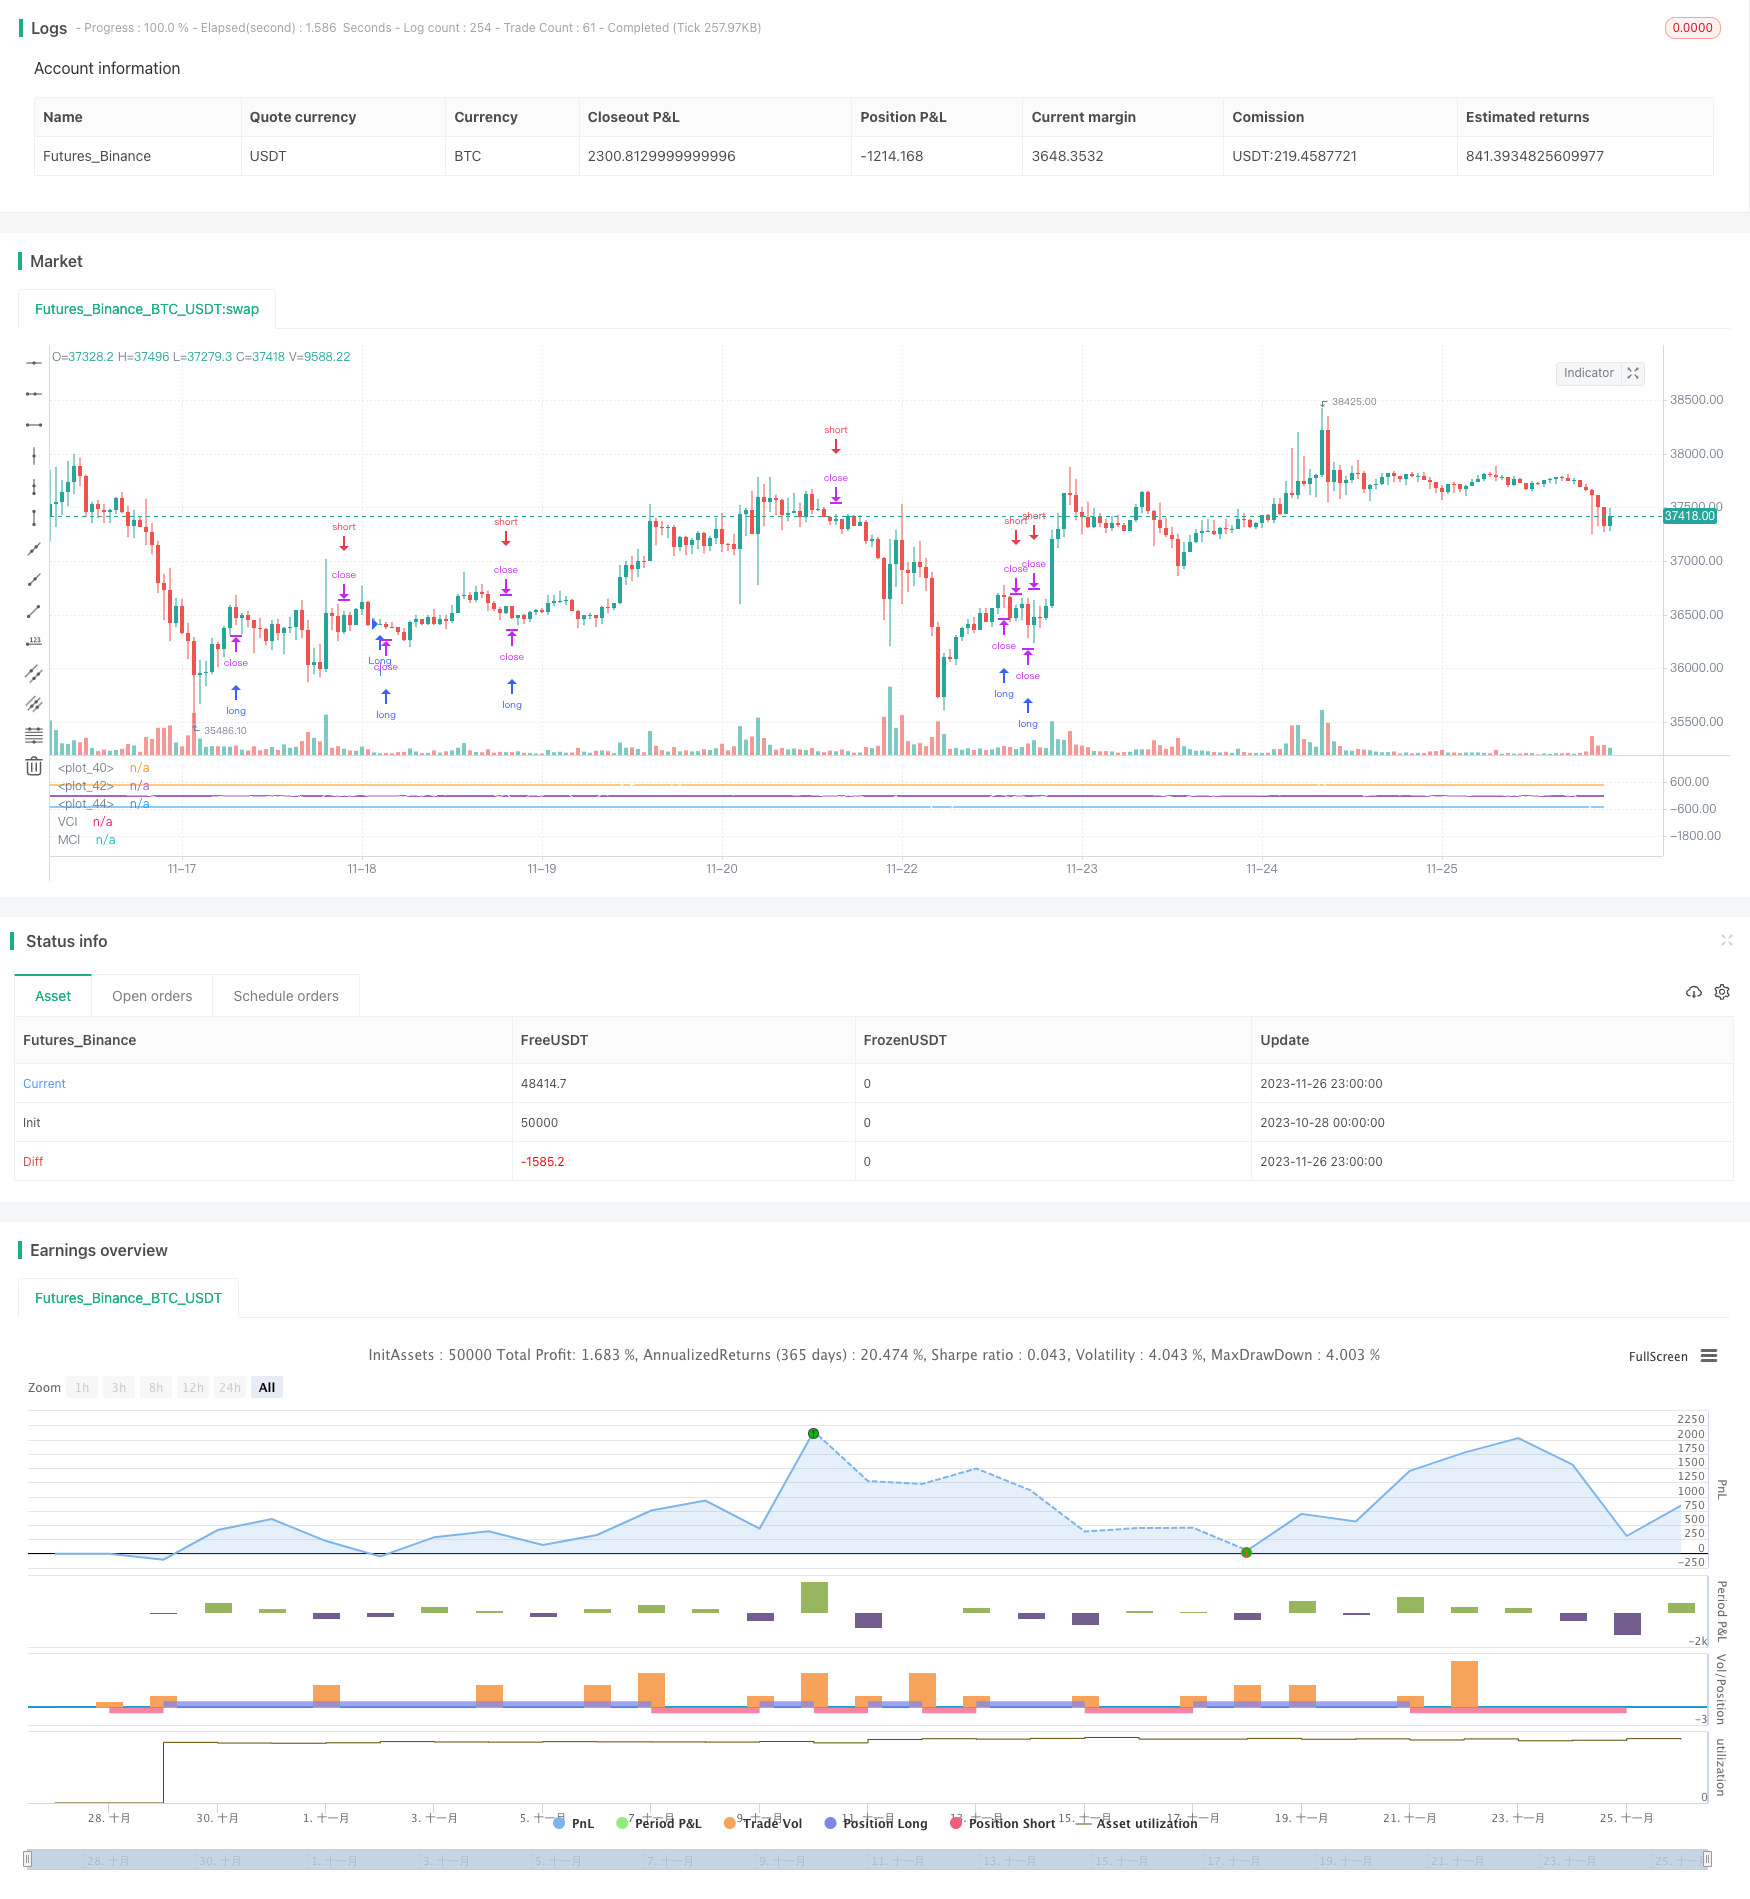
概述
该策略通过结合经典技术指标CCI和自主研发的VCI、MCI双指数形成交易信号,属于典型的量化交易策略。其通过识别Volume和Price的变化趋势,判断当前行情主要交易方向和力度,形成交易信号。可以广泛应用于数字货币、外汇以及股票等金融工具。
策略原理
- 计算ohlc4均线,并结合cci指标判断价位;
- 计算obv指标衡量资金流向;
- 计算VCI指数,即通过obv指标的方差测量资金流量分布;
- 计算MCI指数,即通过价格的方差测量价格分布;
- VCI与MCI指数进行比较,判断市场买卖态势;
- VCI > MCI,买方意愿强;
- VCI < MCI, 卖方意愿强;
- 根据VCI和MCI的比较形成做多做空信号;
优势分析
- 该策略综合考虑了价格、交易量以及资金流向多个维度,判断市场买卖态势,信号较为准确;
- VCI和MCI通过动态标准差计算,能够适应市场的实时变化;
- 策略参数经过大量回测优化,具有较强的稳定性;
风险分析
- 价格和交易量指标计算滞后,不能提前捕捉突发事件;
- 单一策略无法完全覆盖复杂多变的市场情况;
- 需要与其他辅助指标结合使用,不能单独判断市场;
优化方向
- 结合深度学习等预测模型,提高信号判断的准确性;
- 增加止损等风险控制模块,提高策略的稳定性;
- 可尝试不同参数组合,测试在特定市场中的适用性;
总结
该策略通过双cci指数的比较形成交易信号,考虑了价格和交易量等多个因素,对市场买卖力度进行评估,是一种典型且实用的量化交易策略。但仍需与其他辅助工具配合使用,才能发挥策略最大效用。值得进一步优化提高适用场景,减少风险。
策略源码
/*backtest
start: 2023-10-28 00:00:00
end: 2023-11-27 00:00:00
period: 1h
basePeriod: 15m
exchanges: [{"eid":"Futures_Binance","currency":"BTC_USDT"}]
*/

//@version=3
strategy("MCI and VCI - Modified CCI Formulas")
test = cci(ohlc4, 13)
test1 = cci(ohlc4, 20)

obv(src) => cum(change(src) > 0 ? volume : change(src) < 0 ? -volume : 0*volume)
mDisc = input(0, title="Mode Discrepency")
mDiv = input(0.015, title="Interval")
mean(_src, _length)=>
    _return = sum(_src, _length) / _length

median(_src, _length)=>
    _return = _src
    for _i = 0 to _length
        _return := _return == 0 ? _src : (_return + _src[_i]) / 2
    _return


len = input(20, title="Standard (Average) Length")
mmm = input(20, title="Lookback length")
srcV = obv(input(ohlc4))
srcP = input(close)
x = sma(srcV, len)
MDV2 = abs(stdev(median(x, len), mmm))
MDV3 = abs(stdev(mean(x, len), mmm))
AMDV = (MDV2+MDV3)/2
pt1v = (srcV-ema(srcV, len))/ AMDV
pt2v = 1/mDiv
VCI=pt1v*pt2v
y = ema(srcP, len)
MDP2 =  abs(stdev(median(y, len), mmm))
MDP3 = abs(stdev(mean(y, len), mmm))
AMDA = (MDP2 + MDP3)/2
pt1p = 1/mDiv
pt2p = (srcP-ema(srcP, len))/ AMDA
MCI = pt1p * pt2p
plot(VCI, color=yellow, title="VCI", style="Histogram")
plot(MCI, color=white, title="MCI")

plot(500, style=line)

plot(0, style=line, linewidth=2)

plot(-500, style=line)
long = crossover(MCI, 0) and VCI > MCI[2]
short = crossunder(MCI, 0) and VCI < MCI[2]
//Time Control
//Set date and time
FromMonth = input(defval = 9, title = "From Month", minval = 1, maxval = 12)
FromDay   = input(defval = 13, title = "From Day", minval = 1, maxval = 31)
FromYear  = input(defval = 2018, title = "From Year", minval = 2017)
ToMonth   = input(defval = 1, title = "To Month", minval = 1, maxval = 12)
ToDay     = input(defval = 1, title = "To Day", minval = 1, maxval = 31)
ToYear    = input(defval = 9999, title = "To Year", minval = 2017)

// === FUNCTION EXAMPLE ===
start     = timestamp(FromYear, FromMonth, FromDay, 00, 00)  // backtest start window
finish    = timestamp(ToYear, ToMonth, ToDay, 23, 59)        // backtest finish window
window()  => time >= start and time <= finish ? true : false // create function "within window of time"


direction = input(0, title = "Strategy Direction", minval=-1, maxval=1)
strategy.risk.allow_entry_in(direction == 0 ? strategy.direction.all : (direction < 0 ? strategy.direction.short : strategy.direction.long))
if (long)
    strategy.entry("Long", strategy.long, when=window(), limit=ohlc4, oca_name="BollingerBands",  comment="BBandLE")
else
    strategy.cancel(id="Long")

if (short)
    strategy.entry("Short", strategy.short, when=window(), limit=ohlc4, oca_name="BollingerBands", comment="BBandSE")
else
    strategy.cancel(id="Short")