概述
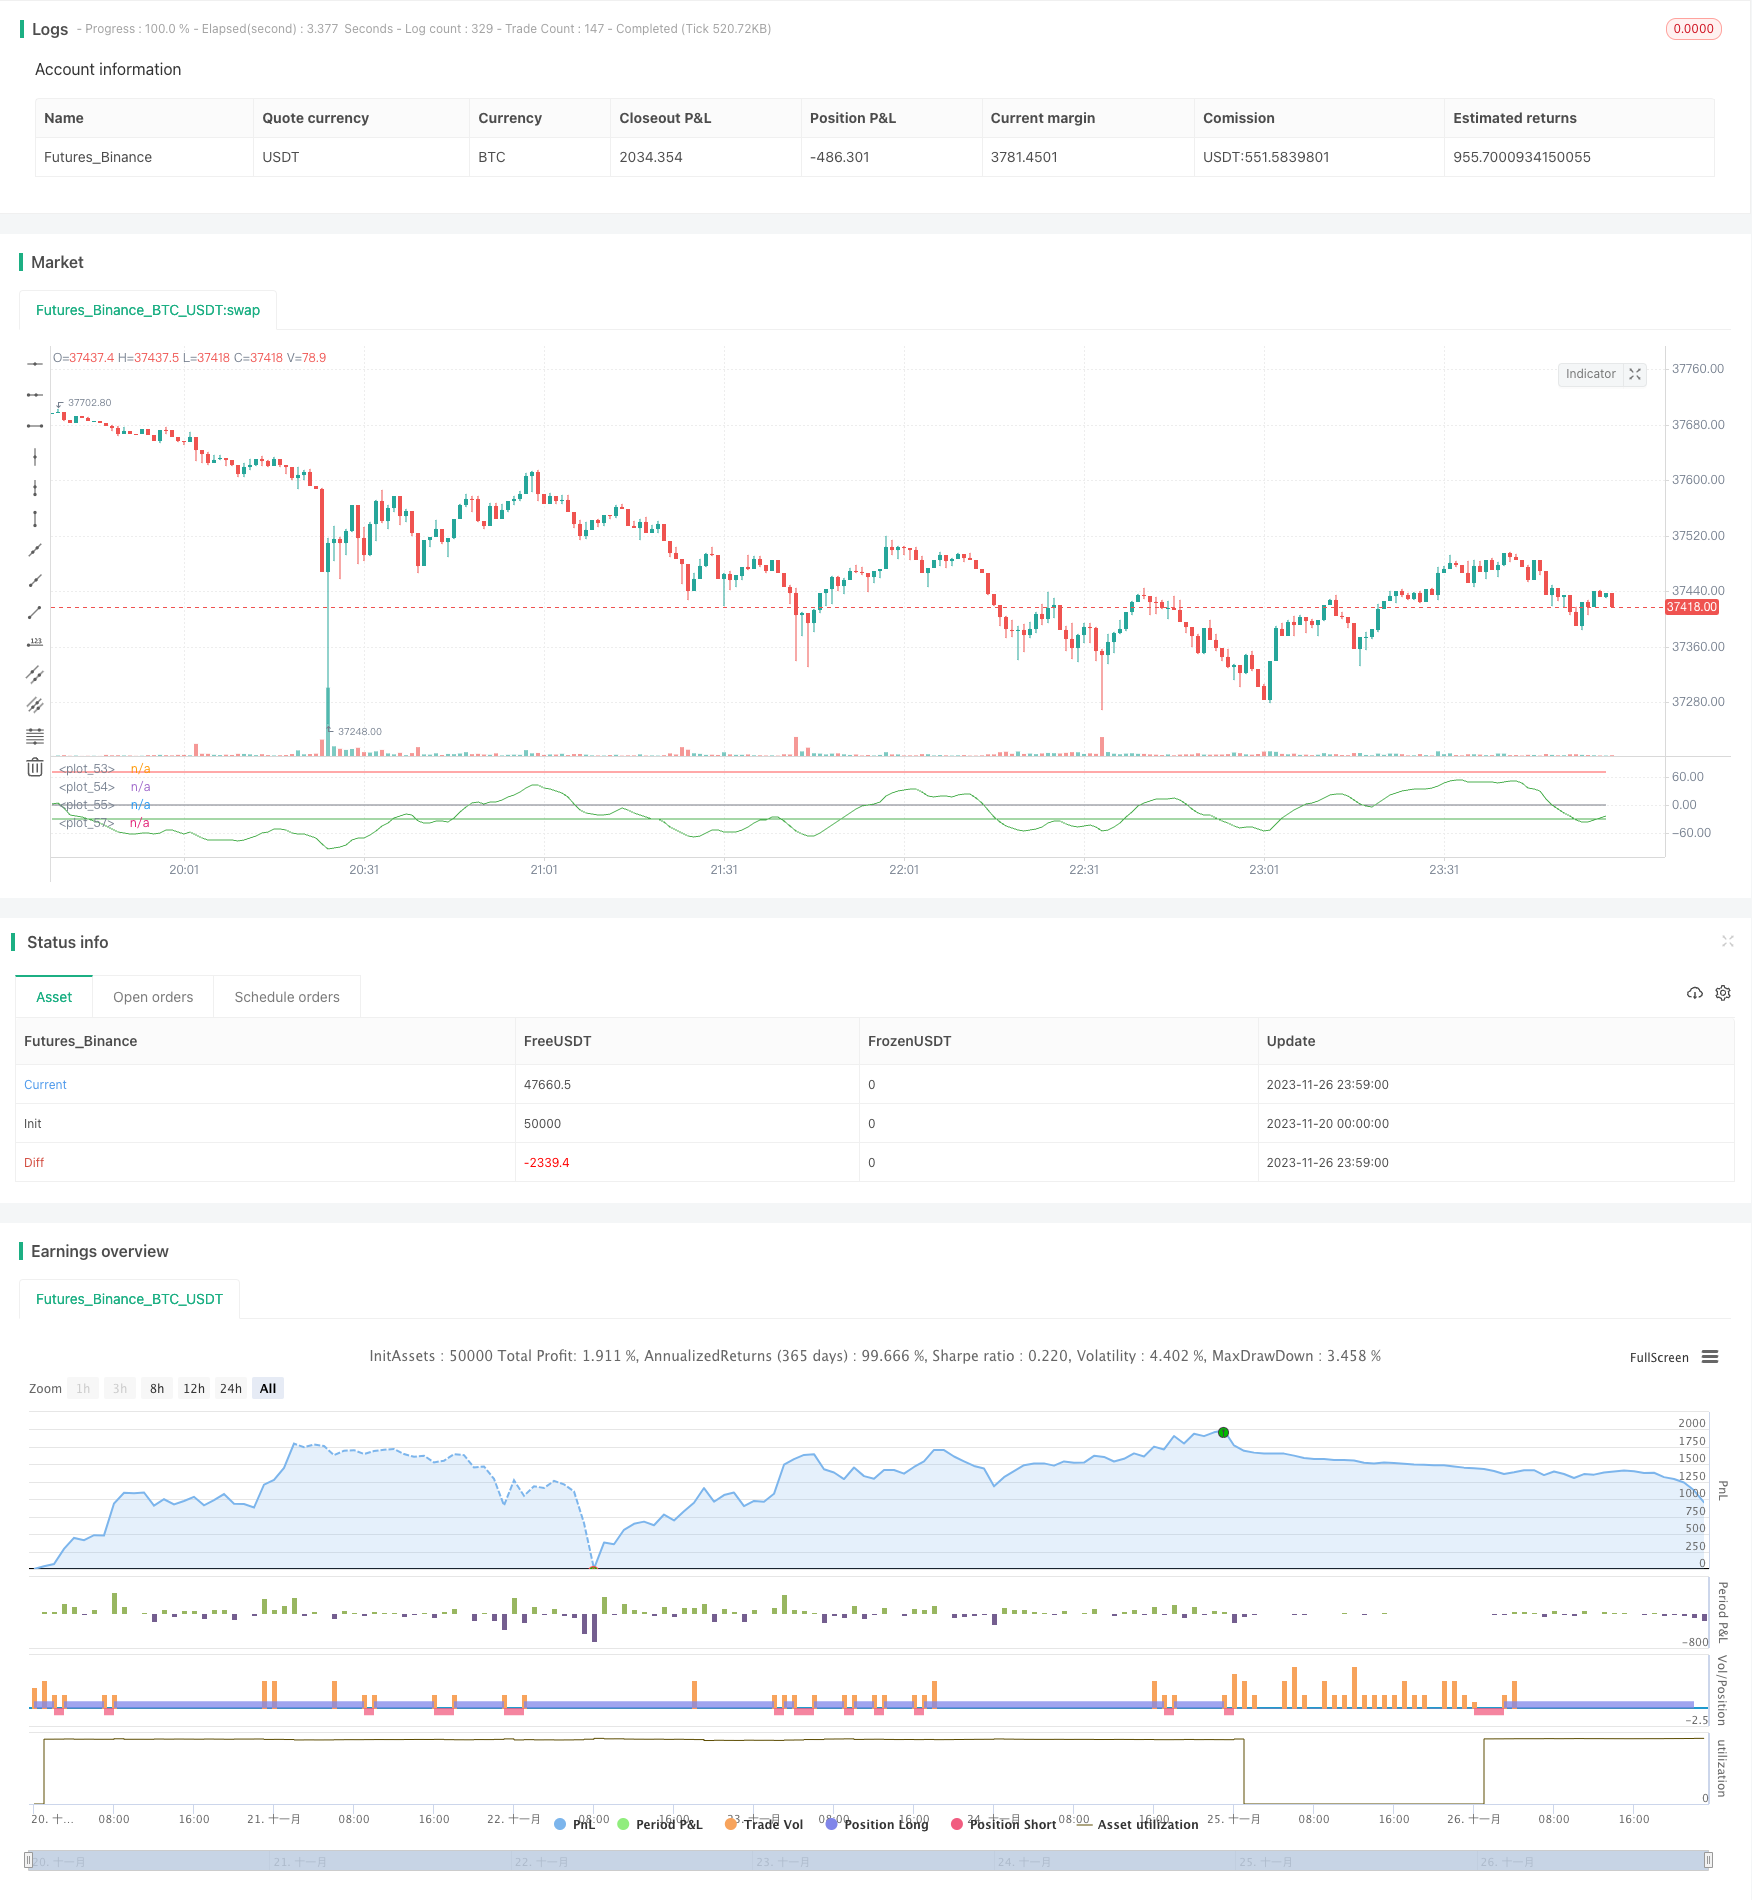
本策略基于波浪趋势指标设计。波浪趋势指标结合价格通道和平均线,可以有效识别市场趋势,发出买入和卖出信号。本策略通过设置波浪趋势的超买超卖线,在指标线突破关键线位时,进行买入或卖出操作。
策略原理
- 计算价格的三角移动平均线ap,以及ap的指数移动平均线esa。
- 计算ap和esa的绝对差值的指数移动平均线d。
- 得到波动指标ci。
- 计算ci的n2周期平均线,得到波浪趋势指标wt1。
- 设置超买线和超卖线。
- 当wt1上穿超卖线时,做多;当wt1下穿超买线时,做空。
优势分析
- 波浪趋势指标突破超买超卖线,可以有效捕捉市场趋势的转折点,精确做出买卖决策。
- 结合价格通道和均线理论,指标不会产生频繁信号。
- 可任意时间周期使用,适用于多种交易品种。
- 指标参数可调节,用户体验良好。
风险及解决
- 大幅震荡市场中,指标会产生错误信号,风险较大。可适当缩短持仓周期,或结合其他指标过滤信号。
- 未考虑仓位管理和止损机制,存在亏损风险。可设置仓位规模和移动止损来控制风险。
优化方向
- 可以考虑与其他指标组合使用,如KDJ、MACD等,形成交易组合,提高策略稳定性。
- 可以设计自动止损机制,如跟踪止损、转速线止损等,控制单笔亏损。
- 可以结合深度学习算法,通过回测数据训练,自动优化参数,提高策略胜率。
总结
本策略基于波浪趋势指标,判断超买超卖情况识别趋势,是一种有效的趋势跟踪策略。相比短期指标,波浪趋势指标可减少错误信号,提高稳定性。结合仓位管理和止损,该策略可以获得稳定收益。通过参数和模型调优,策略效果还可进一步提升。
策略源码
/*backtest
start: 2023-11-20 00:00:00
end: 2023-11-27 00:00:00
period: 1m
basePeriod: 1m
exchanges: [{"eid":"Futures_Binance","currency":"BTC_USDT"}]
*/


//@author SoftKill21
//@version=4

strategy(title="WaveTrend strat", shorttitle="WaveTrend strategy")
n1 = input(10, "Channel Length")
n2 = input(21, "Average Length")
Overbought = input(70, "Over Bought")
Oversold = input(-30, "Over Sold ")

// BACKTESTING RANGE

// From Date Inputs
fromDay = input(defval = 1, title = "From Day", minval = 1, maxval = 31)
fromMonth = input(defval = 1, title = "From Month", minval = 1, maxval = 12)
fromYear = input(defval = 2001, title = "From Year", minval = 1970)

// To Date Inputs
toDay = input(defval = 1, title = "To Day", minval = 1, maxval = 31)
toMonth = input(defval = 12, title = "To Month", minval = 1, maxval = 12)
toYear = input(defval = 2020, title = "To Year", minval = 1970)

// Calculate start/end date and time condition
DST = 1 //day light saving for usa
//--- Europe
London = iff(DST==0,"0000-0900","0100-1000")
//--- America
NewYork = iff(DST==0,"0400-1500","0500-1600")
//--- Pacific
Sydney = iff(DST==0,"1300-2200","1400-2300")
//--- Asia
Tokyo = iff(DST==0,"1500-2400","1600-0100")

//-- Time In Range
timeinrange(res, sess) => time(res, sess) != 0

london = timeinrange(timeframe.period, London)
newyork = timeinrange(timeframe.period, NewYork)

startDate = timestamp(fromYear, fromMonth, fromDay, 00, 00)
finishDate = timestamp(toYear, toMonth, toDay, 00, 00)
time_cond = true //and (london or newyork)

ap = hlc3
esa = ema(ap, n1)
d = ema(abs(ap - esa), n1)
ci = (ap - esa) / (0.015 * d)
tci = ema(ci, n2)

wt1 = tci
wt2 = sma(wt1,4)

plot(0, color=color.gray)
plot(Overbought, color=color.red)
plot(Oversold, color=color.green)

plot(wt1, color=color.green)
longButton = input(title="Long", type=input.bool, defval=true)
shortButton = input(title="Short", type=input.bool, defval=true)

if(longButton==true)
    strategy.entry("long",1,when=crossover(wt1,Oversold) and time_cond)
    strategy.close("long",when=crossunder(wt1, Overbought))

if(shortButton==true)
    strategy.entry("short",0,when=crossunder(wt1, Overbought) and time_cond)
    strategy.close("short",when=crossover(wt1,Oversold))

//strategy.close_all(when= not (london or newyork),comment="time")
if(dayofweek == dayofweek.friday)
    strategy.close_all(when= timeinrange(timeframe.period, "1300-1400"), comment="friday")