Commodity Momentum Index Strategy

Overview
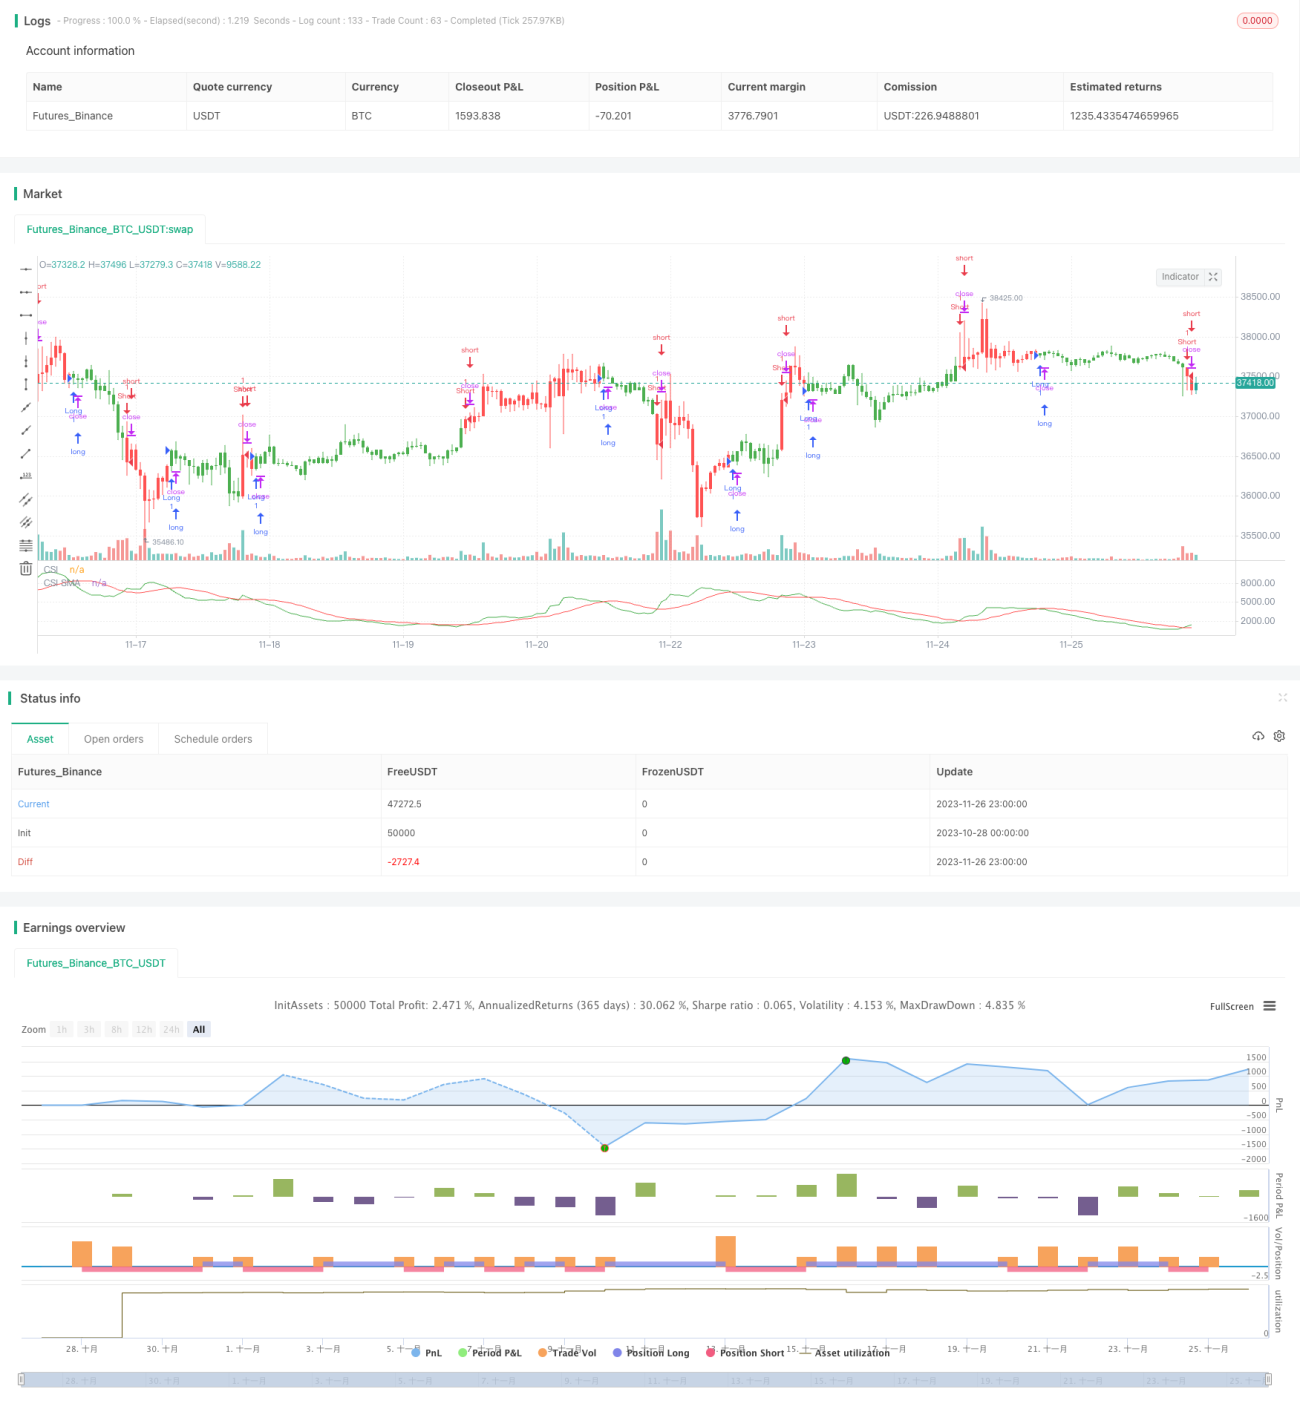
The Commodity Selection Index (CSI) strategy is a short-term trading strategy that tracks market momentum. It identifies commodities with strong momentum by calculating the trend and volatility of commodities for trading. This strategy was proposed by Welles Wilder in his book New Concepts in Technical Trading Systems.
Strategy Principle
The core indicator of this strategy is the CSI index, which takes into account the trend and volatility of commodities. The specific calculation method is:
CSI = K × ATR × ((ADX + n-day moving average of ADX) / 2)
Where K is a scaling factor, ATR represents the Average True Range, which measures market volatility. ADX represents the Average Directional Index, which reflects the trend of the market.
By calculating the CSI index value of each commodity and comparing it with its n-day simple moving average, a buy signal is generated when the CSI is higher than its moving average, and a sell signal is generated when the CSI is lower than its moving average.
The strategy selects commodities with relatively high CSI indices for trading. Because these commodities have very strong trends and fluctuations that can generate greater profit potential in the short term.
Advantage Analysis
This strategy has the following advantages:
- Capture market momentum and make full use of the trend and volatility characteristics of commodities.
- Use dual indicators to make trading signals more reliable.
- Simple and clear trading rules suitable for algorithm trading.
- Specially designed for short-term trading to quickly seize short-term opportunities.
Risk Analysis
The strategy also has some risks:
- Overly dependent on technical indicators, false signals may occur.
- The characteristic of chasing momentum makes it only suitable for short-term operations.
- Excessive fluctuations may trigger stop loss and cause losses to trading.
- Need to withstand a certain degree of leverage and thus face greater capital risk.
To control risks, stop loss positions should be reasonably set, single position size should be controlled, and parameters should be appropriately adjusted to suit different market environments.
Optimization Directions
The strategy can be optimized in the following aspects:
- Test more parameter combinations to find the optimal parameters.
- Add other auxiliary indicators for signal filtering.
- Combine with other strategies such as volatility reversal to form a portfolio.
- Use machine learning to train models to generate more reliable trading signals.
Conclusion
The commodity momentum index strategy realizes simple and fast short-term trading by capturing commodities with strong trends and high volatility in the market. This specialized approach of tracking momentum makes its signals clear and easy to implement algorithmically. Of course, it is also necessary to pay attention to risk control and continue to improve and upgrade to adapt to changes in market conditions.
/*backtest
start: 2023-10-28 00:00:00
end: 2023-11-27 00:00:00
period: 1h
basePeriod: 15m
exchanges: [{"eid":"Futures_Binance","currency":"BTC_USDT"}]
*/

//@version=3
////////////////////////////////////////////////////////////
//  Copyright by HPotter v1.0 20/03/2019
// The Commodity Selection Index ("CSI") is a momentum indicator. It was - 1