Momentum Trading Strategy Based on CMO and WMA

Overview
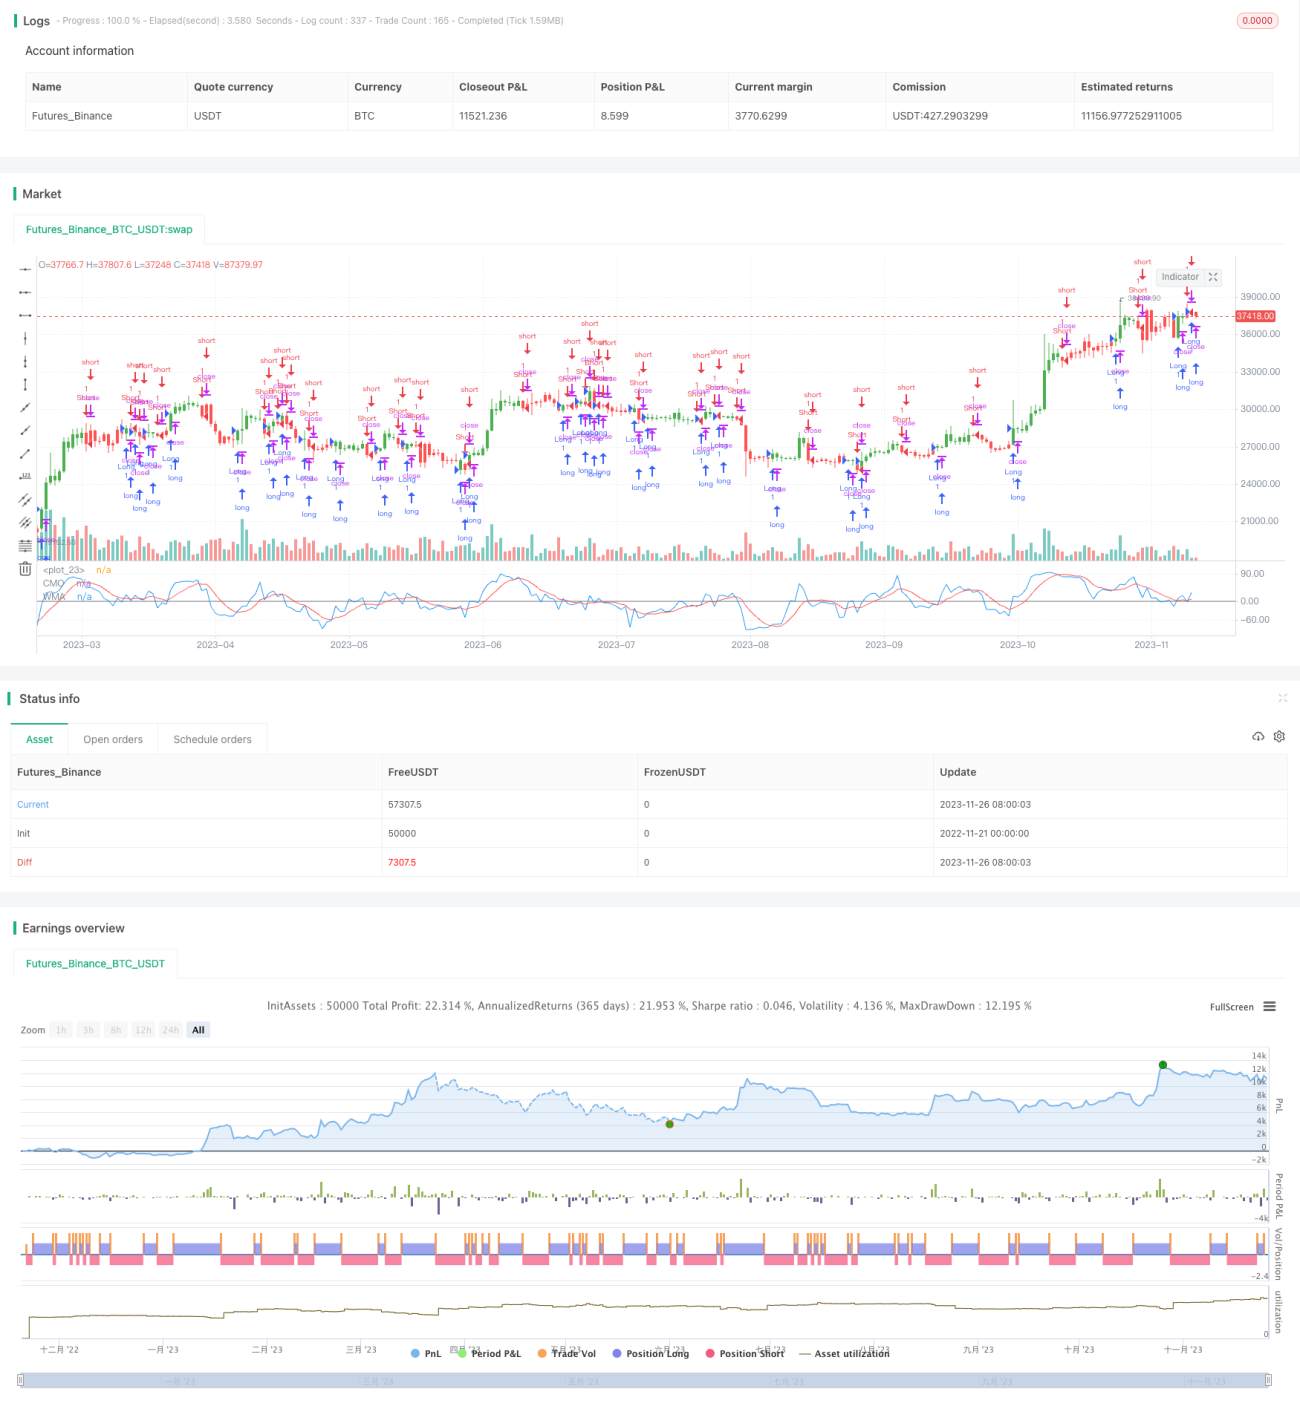
The strategy is named "Momentum Trading Strategy Based on CMO and WMA". It utilizes Chande Momentum Oscillator (CMO) and its Weighted Moving Average (WMA) to construct trading signals. The core idea is to go long when CMO crosses above its WMA and go short when crossing below. It also considers the option of reverse trading.
Strategy Logic
The core indicator of this strategy is CMO. CMO is closely related to other momentum indicators like RSI, but also has its uniqueness. CMO directly measures price change momentum. Its calculation is based on raw unsmoothed data, so it reflects extreme short-term price changes. The CMO value ranges from +100 to -100, which makes it convenient to compare absolute momentum strength across securities.
The strategy first calculates the one-day price change abs(close - close[1]) as the original momentum xMom. Then it calculates the SMA of xMom over Length days, denoted as xSMA_mom. After that, it calculates the price change over Length days xMomLength, namely close - close[Length]. Finally, CMO is calculated as xMomLength divided by xSMA_mom then multiplied by 100. This CMO is smoothed by a WMA (parameter LengthWMA) to derive xWMACMO. The trading signal is to go long (short) when CMO crosses above (below) its WMA.
Advantages
The biggest advantage of this strategy is capturing momentum characteristics within price trends. The bounded design of CMO reflects momentum changes more directly. Compared to SMA, WMA smoothes out short-term noise better. So this strategy can effectively identify entry points within medium-to-long term trends. In addition, the combination of CMO and WMA provides better stability than a single indicator.
Risks
The biggest risk of this strategy is the high trading frequency leading to increased slippage costs. Both CMO and WMA have short-term parameters, which may cause excessive meaningless whipsaws. This is especially severe when the trading vehicle has large fluctuations. In addition, fixed parameters fail to adapt to changing market environments.
We can consider introducing adaptive optimization of CMO and WMA parameters, enabling them to adjust dynamically. Adding filter conditions to reduce unnecessary trading is another option. Lowering volatility via portfolio diversification also helps.
Enhancement Directions
The strategy can be enhanced from the following aspects:
-
Add adaptive CMO parameter mechanism to find optimal parameters for different volatility regimes;
-
Add adaptive WMA parameter mechanism so the smoothing effect changes accordingly;
-
Add filter conditions such as Volatility Index to control meaningless whipsaws;
-
Consider combining with other indicators to improve stability;
-
Optimize stop loss mechanism. Set dynamic stop loss line to actively control single round loss.
Conclusion
The strategy realizes simple and effective trend following based on CMO and WMA. Its advantage lies in clearly capturing price momentum characteristics. But it also has some weakness in profit retention capability after opening positions. Both parameter tuning and combo can greatly improve stability. Overall, this strategy has lots of room and value for improvement.
/*backtest
start: 2022-11-21 00:00:00
end: 2023-11-27 00:00:00
period: 1d
basePeriod: 1h
exchanges: [{"eid":"Futures_Binance","currency":"BTC_USDT"}]
*/

//@version=2
////////////////////////////////////////////////////////////
//  Copyright by HPotter v1.0 13/02/2017
// This indicator plots Chandre Momentum Oscillator and its WMA on the - 1