Dynamic Support and Resistance Strategy Based on Historical Data

Overview
This strategy dynamically calculates support and resistance levels based on historical high, low and close prices, and generates trading signals accordingly. It is suitable for medium-to-long-term positions and can effectively utilize support and resistance levels in the market for profit.
Strategy Logic
-
Calculate the average of previous period's high, low and close prices as the pivot point (PP).
-
Calculate 3 support lines: S1 = 2PP - highest price; S2 = PP - (R1-S1); S3 = lowest price - 2(highest price - PP).
-
Calculate 3 resistance lines: R1 = 2PP - lowest price; R2 = PP + (R1-S1); R3 = highest price + 2(PP - lowest price).
-
Take long position when price breaks through resistance lines, take short position when price breaks through support lines.
Advantage Analysis
-
The dynamic support and resistance levels based on historical data can capture market structure changes timely.
-
The multi-layer support and resistance settings allow better risk management optimization.
-
Simple and intuitive trading signals and stop loss mechanism.
Risk Analysis
-
The reference price levels provided by historical data may become invalid in high volatility scenarios.
-
The switching between long and short positions should consider trading cost.
-
Data quality needs to ensured to avoid calculation errors.
Optimization Directions
-
Consider incorporating more historical data references like 100-day moving average etc.
-
Optimize position sizing, e.g. adjust position size based on volatility.
-
Add stop loss strategies like trailing stop loss or risk-based stop loss.
Summary
This strategy provides multi-layer support and resistance reference price levels based on history. It has simple and straightforward logic suitable for medium-to-long-term positions. Meanwhile, risks under high volatility market and trading costs should be monitored. Further optimizations can make the strategy robust under complex environments.
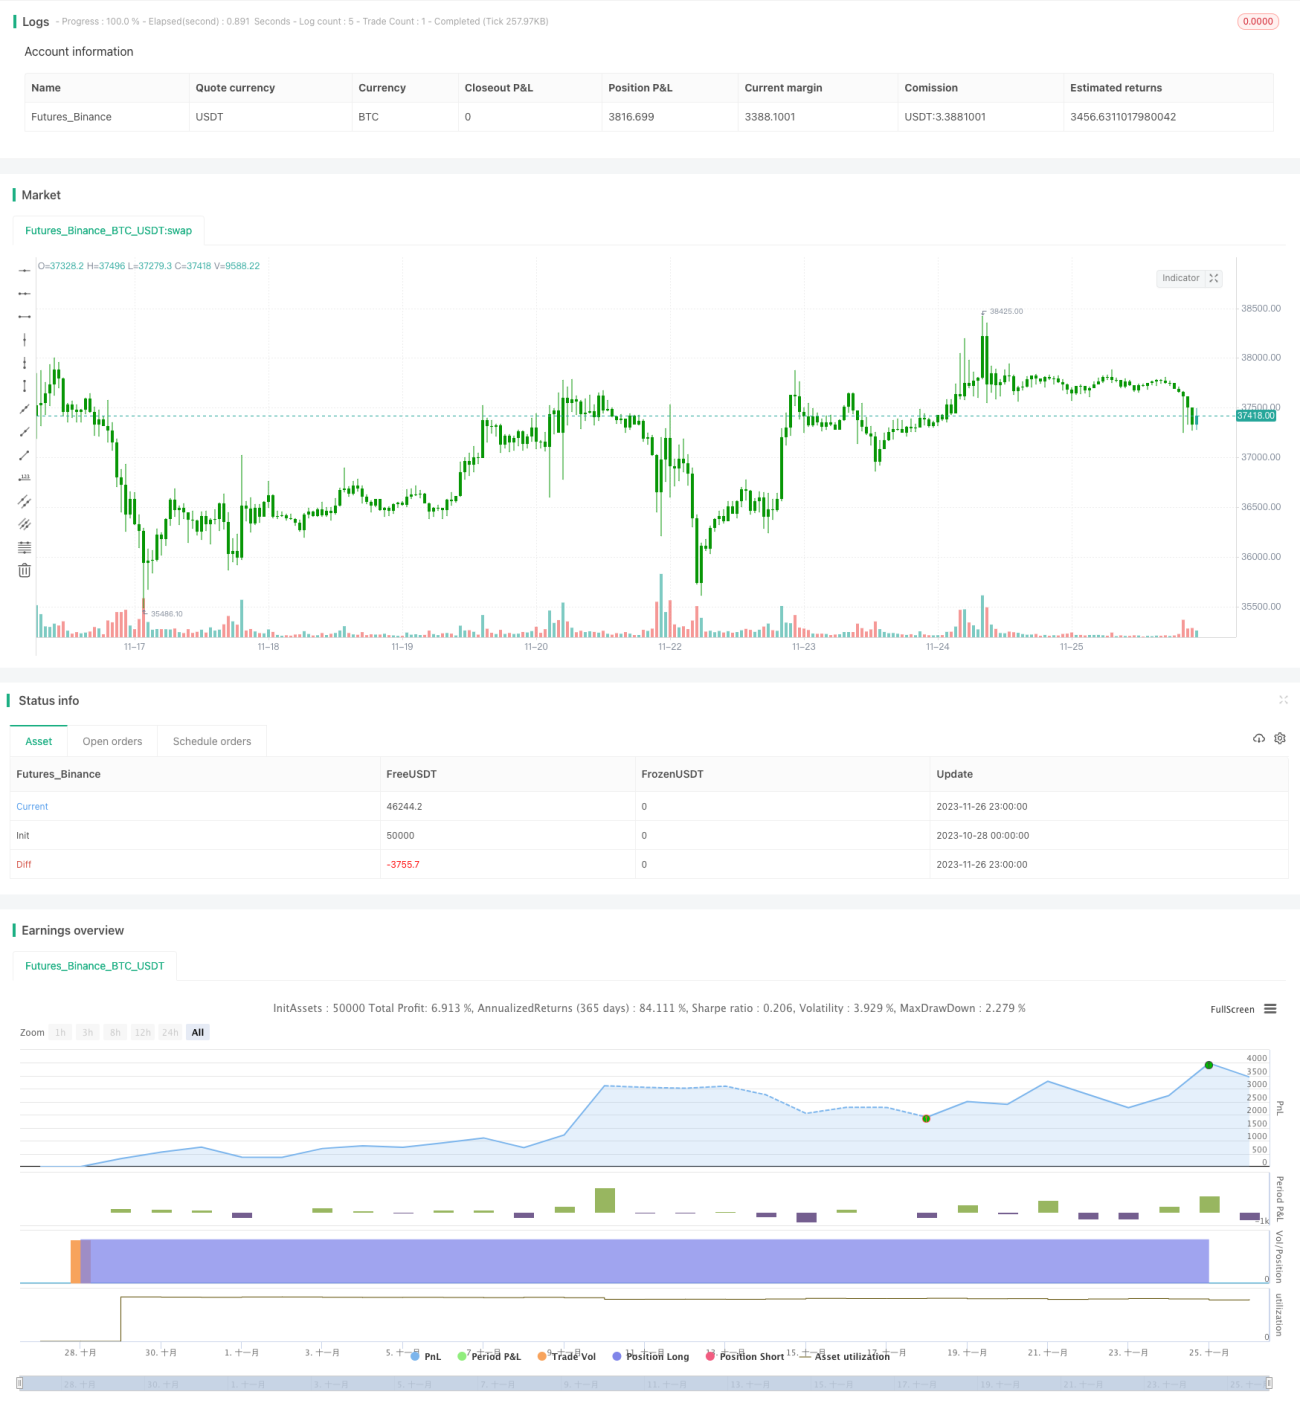
/*backtest
start: 2023-10-28 00:00:00
end: 2023-11-27 00:00:00
period: 1h
basePeriod: 15m
exchanges: [{"eid":"Futures_Binance","currency":"BTC_USDT"}]
*/

//@version=4
////////////////////////////////////////////////////////////
//  Copyright by HPotter v1.0 09/06/2020
// Pivot points simply took the high, low, and closing price from the previous period and - 1