RSI Moving Average Crossover Trend Strategy

Overview
The RSI Moving Average Crossover Trend Strategy is a strategy that uses the moving average crossover signals of the RSI indicator to determine the trend and issue trading signals. The strategy also incorporates the price EMA, issuing buy signals only when the price is above the EMA.
Strategy Logic
The core indicator of this strategy is RSI. It calculates both the EMA and SMA of the RSI. Buy signals are only issued when the RSI EMA is above the SMA while the price is above the EMA. Sell signals are issued when the RSI EMA falls below the SMA to follow the trend.
The RSI indicator can effectively reflect overbought and oversold conditions in the market. Breaking above 70 on the RSI is regarded as overbought while breaking below 30 is oversold. This strategy utilizes the EMA and SMA to discover trends and turning points of the RSI indicator. The EMA reacts faster to recent price changes while the SMA relies more on older data. The two lines work together.
When the RSI EMA starts picking up, it signals stabilization in the market. The SMA then verifies the direction. When the SMA also starts rising, it confirms the RSI is in an uptrend. The strategy will now issue a buy signal given that the price is above EMA to follow the trend.
Advantage Analysis
This is a trend following strategy, capable of effectively catching directional opportunities over the medium to long term. Compared to single indicators, this strategy uses RSI EMA and SMA crossover for verification, reducing false signals and increasing stability.
The strategy also incorporates the price EMA to ensure buying only in a price uptrend, avoiding the risk of range-bound markets and improving profitability.
Risk Analysis
The strategy relies mainly on the RSI indicator. False RSI signals will lead to false strategy signals. Also, the RSI is more suitable for identifying overbought/oversold levels with some lag in catching mid-long term trends.
There can also be some time lag, especially when the RSI EMA and SMA are more range-bound. This period carries some loss risk before signals are triggered.
Optimization Directions
-
The RSI can be optimized by selecting more appropriate parameters to enhance effectiveness.
-
Stop loss logic can be added to exit positions after losses reach certain levels to effectively manage risk.
-
Parameters can be tested and optimized across different timeframes so that the strategy can run stable on more products and periods.
Summary
The RSI Moving Average Crossover Trend Strategy is a simple trend following strategy using RSI to determine trend direction and crossovers for verification. It incorporates price EMA to buy on uptrends. The strategy has high stability for mid-long term holding but lag risk needs to be managed. Further optimizations can improve strategy performance.
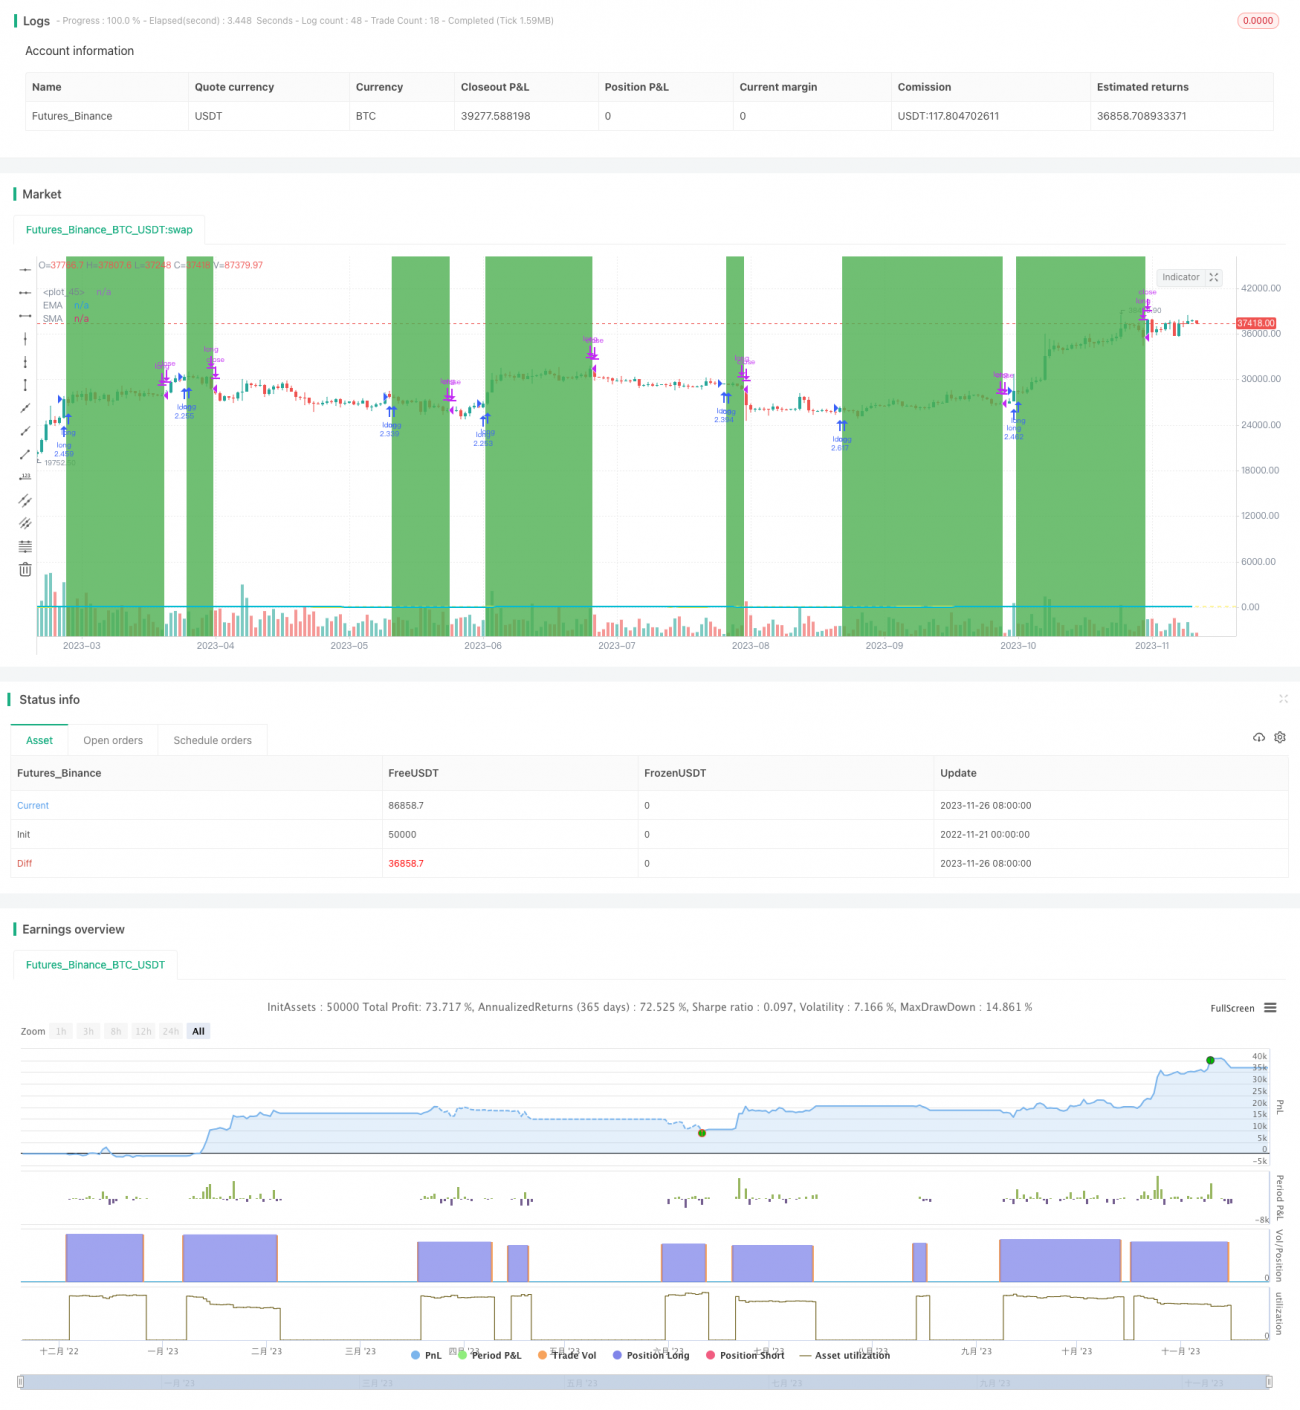
/*backtest
start: 2022-11-21 00:00:00
end: 2023-11-27 00:00:00
period: 1d
basePeriod: 1h
exchanges: [{"eid":"Futures_Binance","currency":"BTC_USDT"}]
*/

//@version=4
//Created by Sv3nla 5-Jan-2021
strategy(title="Sv3nla RSI EMA SMA Strat", shorttitle="Sv3nla RSI EMA SMA Strat", overlay=true, initial_capital=1000, default_qty_type=strategy.percent_of_equity, default_qty_value=100)
- 1