FiboBuLL Wave Strategy Based on Bollinger Bands Breakout

Overview
The FiboBuLL Wave strategy is adapted from the filter version of the Bollinger Bands study, which can be found under my scripts page. The strategy goes long when the price closes above the upper band and goes short when the price closes below the lower band.
Bollinger Bands is a classic indicator that uses a simple moving average of 20 periods, along with plots of upper and lower bands that are 2 standard deviations away from the middle band. These bands help visualize price volatility and trend based on where the price is relative to the bands.
The strategy does not take into account any other parameters such as Volume / RSI / Fundamentals etc, so user must use discretion based on confirmations from other indicators or fundamentals. The strategy results are purely based on long and short trades and do not take into account any user defined targets or stop losses.
It works best when there is continuation the bar after price closes above/below upper/lower bands. It is definitely beneficial to use this strategy or the Bollinger Bands filter along with other indicators to get early glimpse of breach/fail of bands on candle close during BB squeeze or based on volatility.
The strategy can be used on Heikin Ashi candles for spotting trends but HA candles are not recommended for trade entries as they don't reflect true price of the asset.
Strategy Logic
The core logic behind FiboBuLL Wave strategy is to trade based on the breakout of Bollinger Bands. The Bollinger Bands consists of a middle band, upper band and lower band. The middle band is a 21-period simple moving average of closing price; The upper band is calculated by adding 1 standard deviation above the middle band, reflecting the upper range of price fluctuation; The lower band is derived by subtracting 1 standard deviation below the middle band, reflecting the lower range of price movement.
A long signal is generated when the closing price breaks above the upper band; A short signal is triggered when the closing price breaks below the lower band. After taking long or short positions, existing trades will be closed out when price breaks the opposite band again.
The strategy uses barssince function to track the breakout of price relative to upper and lower bands. A long signal is generated when the number of bars since upper band breakout is less than that of lower band. A short signal is triggered when the number of bars since lower band breakout is less than that of upper band.
By adjusting the middle band period and standard deviation multiplier parameters, the breakout sensitivity of Bollinger Bands can be changed, thereby adjusting the timing of entry.
Advantages
The FiboBuLL Wave strategy has some advantages:
- Simple logic based on BB breakout, easy to understand
- Breakout sensitivity can be controlled by adjusting parameters
- BB bands visualize price fluctuation and trend
- Can combine with other indicators, improve accuracy
- Applicable to multiple timeframes
Risks
There are also some risks to note for the FiboBuLL Wave strategy:
- Prone to false signals relying purely on BB breakout
- Unable to determine the momentum and duration after breakout
- No exit rules for reversal
- High risk without stop loss
The optimizations can be made in the following aspects:
- Add filters using other indicators to avoid false signals
- Optimize parameters based on historical data
- Set stop loss to limit maximum loss
- Consider adding reversal factors to determine persistence
Enhancement Opportunities
The main optimization directions for FiboBuLL Wave strategy:
- Add volume indicators e.g. A/D line to avoid weak breakout
- Combine overbought/oversold indicators e.g. RSI to improve accuracy
- Optimize parameters like period and deviation multiplier based on backtest results
- Set stop loss and take profit to control risk and lock in profits
- Consider trend and reversal filters to determine directional persistence
- Test optimum parameters across different products and timeframes
With above enhancements, the stability and profitability of the FiboBuLL Wave strategy can be greatly improved.
Summary
The FiboBuLL Wave strategy utilizes the basic principle of Bollinger Bands in identifying breakouts and reversions to the middle band to track price volatility. With its simple concept and wide applicability, it serves as an effective approach in gauging market fluctuation.
However, relying solely on breakout tends to generate false signals and whipsaws. Hence confirmations using volume, trends, indicators etc. must be incorporated to determine breakout reliability, while implementing stop loss/take profit to control risks, in order to maximize the strategy’s usefulness.
The FiboBuLL Wave strategy provides a basic framework for designing trades based on price action. With constant optimizations and integration of additional factors, it has the potential to become a robust tool in formulating trading decisions.
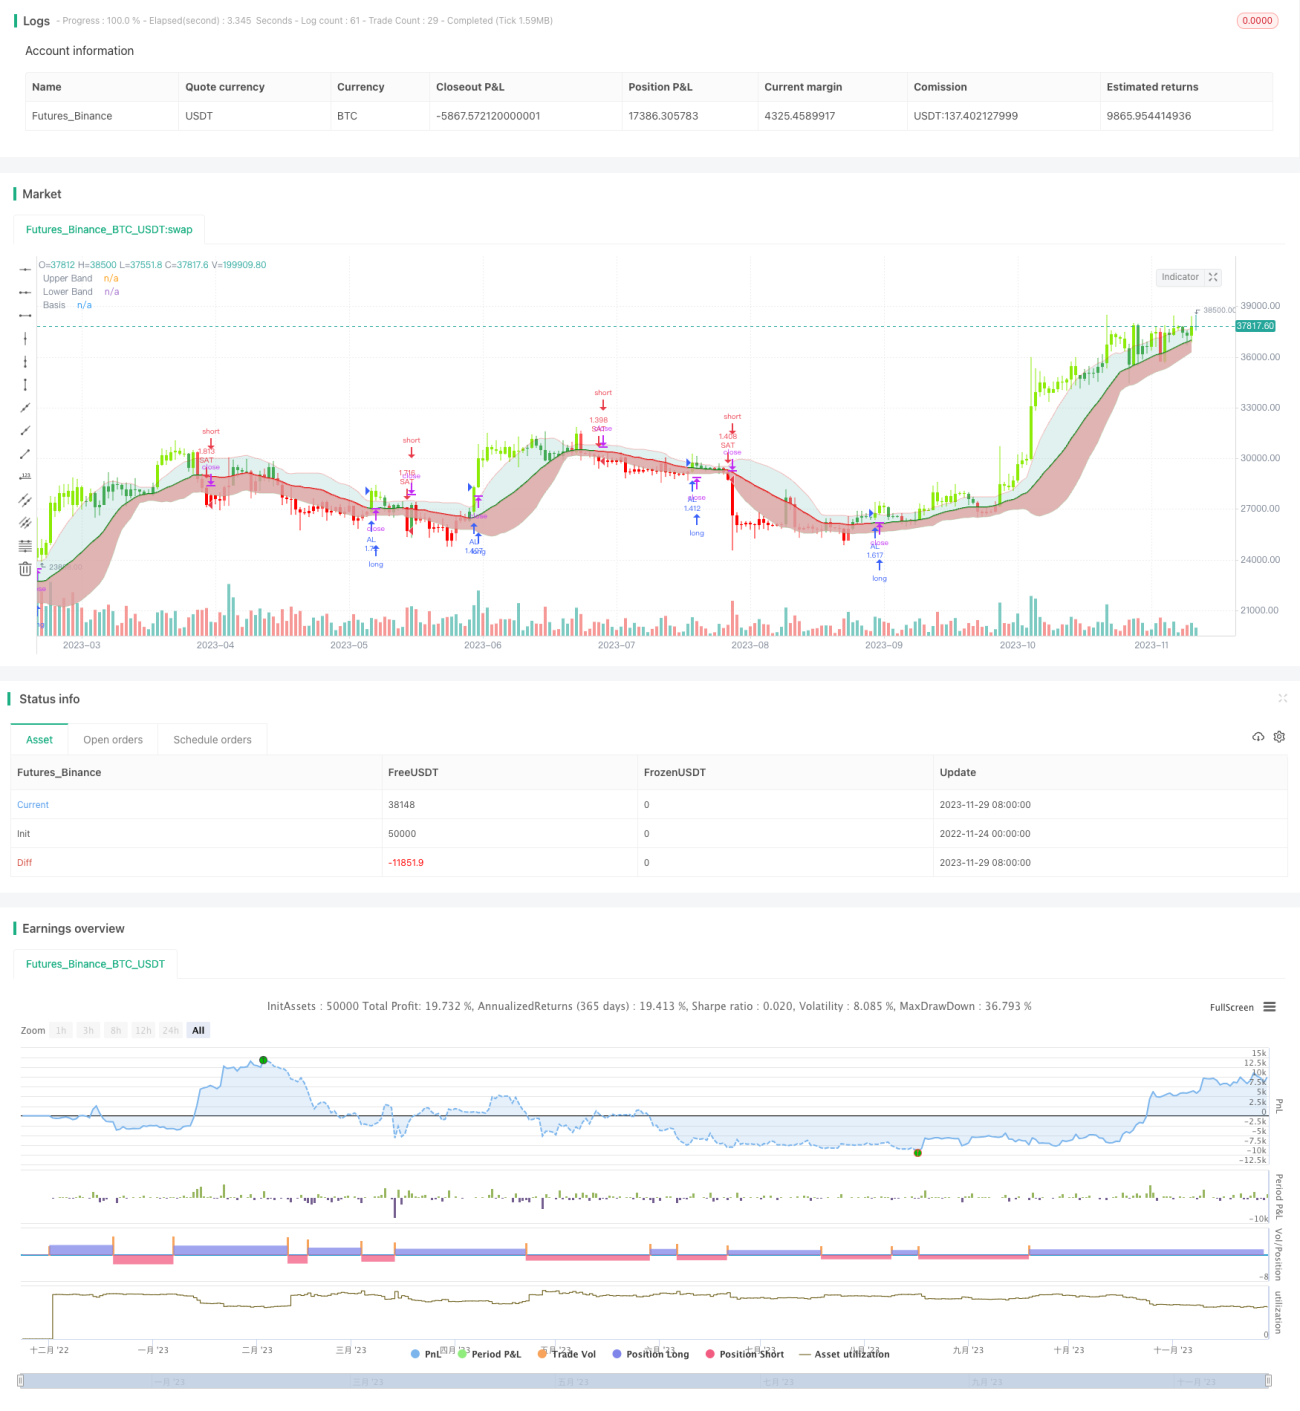
/*backtest
start: 2022-11-24 00:00:00
end: 2023-11-30 00:00:00
period: 1d
basePeriod: 1h
exchanges: [{"eid":"Futures_Binance","currency":"BTC_USDT"}]
*/

//@version=5
//@FiboBuLL

strategy(shorttitle='FB Wave', title='FiboBuLL Wave (A version of Bollinger Bands Breakout Strategy By Trade Chartist)', overlay=true, pyramiding=1, currency=currency.NONE, initial_capital=100000, default_qty_type=strategy.percent_of_equity, default_qty_value=100)- 1