Volatility Capture RSI-Bollinger Band Strategy

Overview
The Volatility Capture RSI-Bollinger Band strategy is a trading strategy that integrates the concepts of Bollinger Bands (BB), Relative Strength Index (RSI) and Simple Moving Average (SMA) to generate trading signals. The uniqueness of this strategy is that it calculates a dynamic level between the upper and lower Bollinger Bands based on the closing price. This unique feature allows the strategy to adapt to market volatility and price movements.
The crypto and stock markets are highly volatile, making them suitable for a strategy using Bollinger Bands. The RSI can help identify overbought or oversold conditions in these often speculative markets.
How it Works
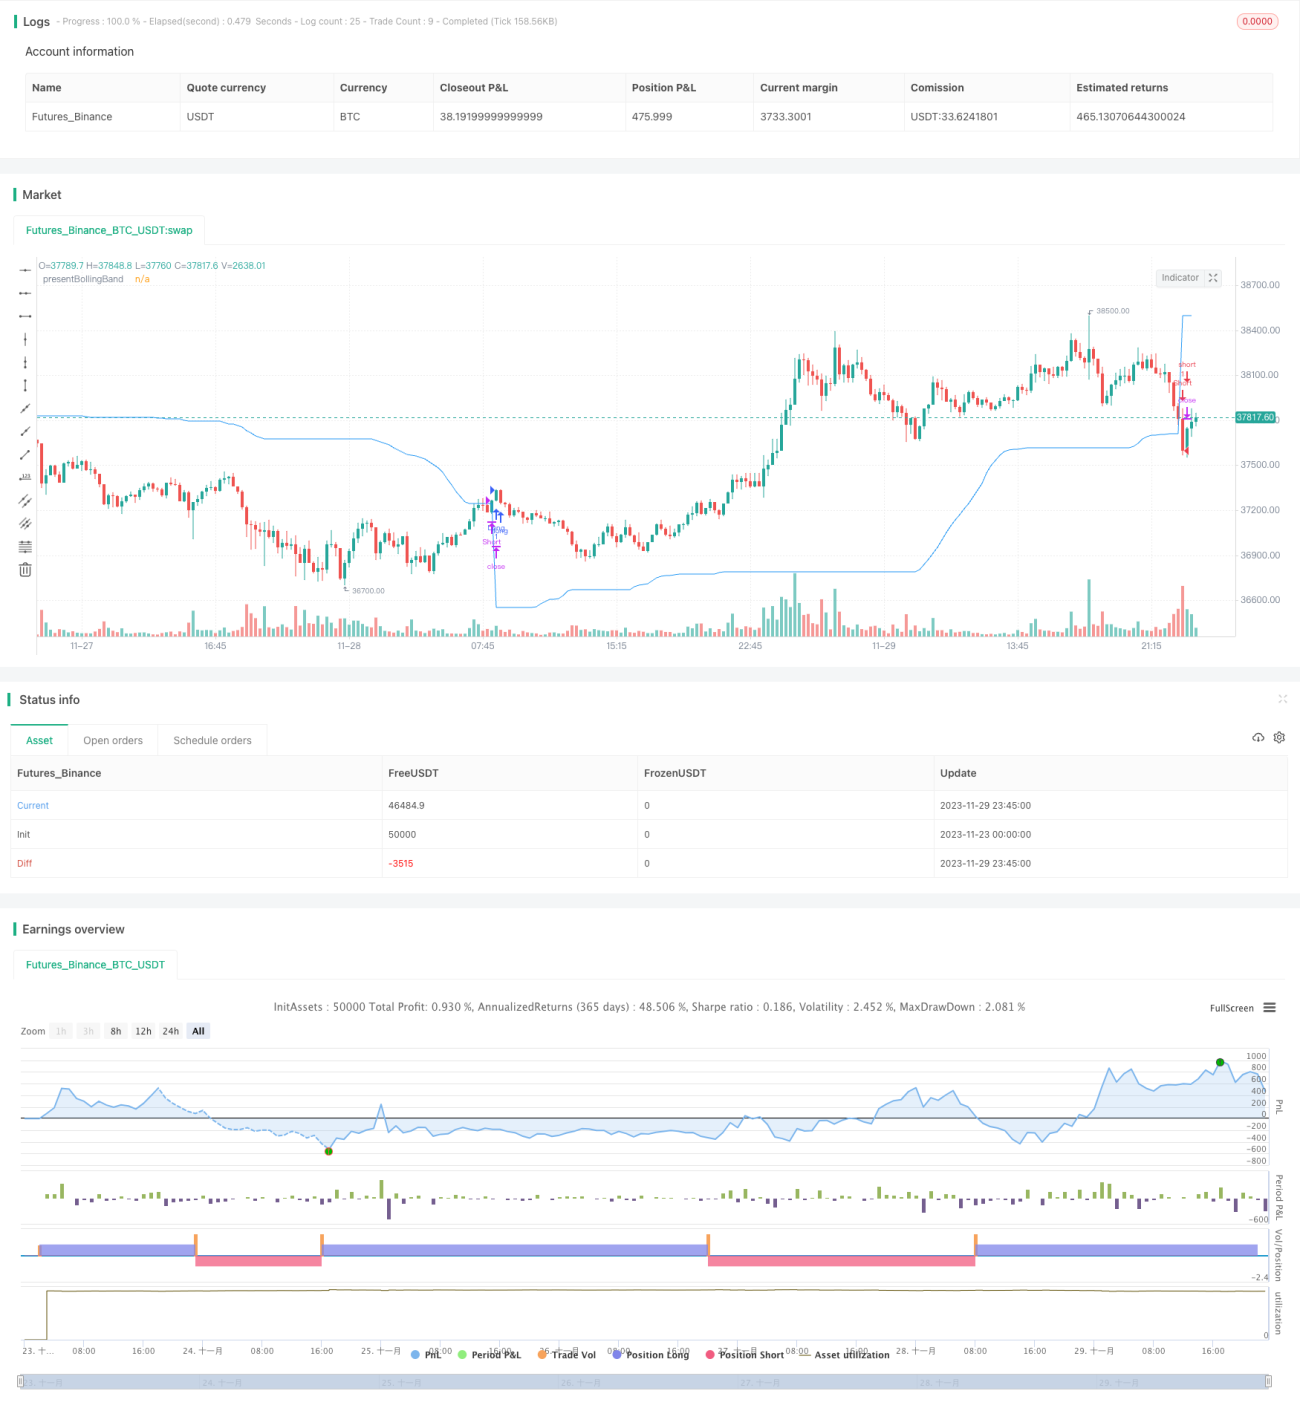
Dynamic Bollinger Band: The strategy first calculates the upper and lower Bollinger Bands based on user-defined length and multiplier. It then uses the Bollinger Bands and closing price to dynamically adjust the presentBollingBand value. Finally, it generates a long signal when price crosses over the present Bolling Band and a short signal when price crosses under.
RSI: If the user chooses to use RSI for signals, the strategy also calculates the RSI and its SMA, and uses them to generate additional long and short signals. The RSI signals are only used if the ‘Use RSI for signals’ option is enabled.
The strategy then checks the selected trade direction and enters long or short positions accordingly. If set to ‘Both’, it can enter both long and short positions.
Finally, the strategy exits a position when the close price crosses under/over the present Bolling Band for long/short positions respectively.
Advantage Analysis
The strategy combines the strengths of Bollinger Bands, RSI and SMA to adapt to market volatility, dynamically capture fluctuations and generate trading signals at overbought/oversold levels.
The RSI supplements Bollinger signals, avoiding false entries in ranging markets. Allowing long-only, short-only or both directions caters to different market conditions.
Customizable parameters enable tuning based on individual risk preferences.
Risk Analysis
The strategy relies on technical indicators and cannot anticipate fundamental-driven major reversals.
Improper Bollinger parameter settings may generate too frequent or too sparse signals.
Two-way trading magnifies risk, beware of reverse short losses.
Using stops to control risk is recommended.
Optimization Directions
-
Add other filters like MACD to filter signals.
-
Incorporate stop loss strategies.
-
Optimize Bollinger and RSI parameters.
-
Adjust parameters for different products and timeframes.
-
Consider live tuning parameters to fit actual conditions.
Summary
The Volatility Capture RSI-Bollinger strategy is a technical indicator-driven strategy, combining the strengths of Bollinger Bands, RSI and SMA by dynamically adjusting the Bollinger Bands to capture market fluctuations. The strategy allows high customizability and optimization but cannot predict fundamental changes. Real-trading verification and parameter tuning or adding other indicators to reduce risk when necessary are recommended.
- 1