Modified Price-Volume Trend Strategy Based on Price-Volume Changes

Overview
The name of this strategy is "Modified Price-Volume Trend Strategy Based on Price-Volume Changes". This strategy calculates the cumulative changes in price and volume, combined with moving average lines to establish long and short positions, in order to track the trend.
Strategy Principle
The core indicator of this strategy is the Modified Price Volume Trend (MPVT) indicator. This indicator reflects the market enthusiasm and capital inflows and outflows through the changes in price and trading volume. The specific calculation formula is as follows:
rV = Volume / 50000
xCumPVT = Yesterday's xCumPVT + (rV * (Latest Close Price - Yesterday's Close Price) / Yesterday's Close Price)
Then combined with the Level and Scale parameters, construct the Price-Volume Change Residence indicator:
nRes = Level + Scale * xCumPVT
The Residence indicator reflects the combined changes in price and volume. When it crosses above its N-day simple moving average, go long. When it falls below its N-day simple moving average, go short.
Advantage Analysis
The main advantages of this strategy are:
-
Judging market enthusiasm and capital flow direction through price-volume indicators can timely capture turning points of the trend.
-
Flexible adjustment of strategy parameters through parameter optimization to adapt to different market environments.
-
The shorting strategy can be realized by setting the reverse input parameter to expand the application scenario of the strategy.
Risk Analysis
There are also some risks in this strategy:
-
Price-volume indicators are prone to false signals, and there may be cases where breakthroughs do not hold. Parameters can be adjusted or combined with other indicators for filtering.
-
It is more suitable for trend markets, and may produce false signals in range-bound markets. Can consider combining with trend and volatility indicators.
-
The effect of parameter optimization depends on the historical cycle, which may lead to over-fitting risks. Parameters should be adjusted appropriately or stepwise optimization methods adopted.
Optimization Directions
The following aspects can be considered to optimize this strategy:
-
Test different moving averages, such as weighted moving average, EMA, etc. to see which combination works better.
-
Combine with other indicators, such as RSI, KD, etc. to filter signals and reduce the probability of false signals.
-
Test different parameter combinations to find the optimal parameter pair. Stepwise optimization methods can also be adopted to update parameters in real time.
-
Improve the stability of the strategy by combining it with trend-following indicators such as Bollinger Bands.
Summary
This strategy calculates the cumulative changes in price and volume to design a Price-Volume Change Residence indicator, which can effectively reflect capital inflows and outflows. It is a typical price-volume COMBO strategy. The strategy is simple and practical, suitable for trend markets, with large optimization space through parameter optimization and indicator combination optimization, and is a highly recommended trend strategy.
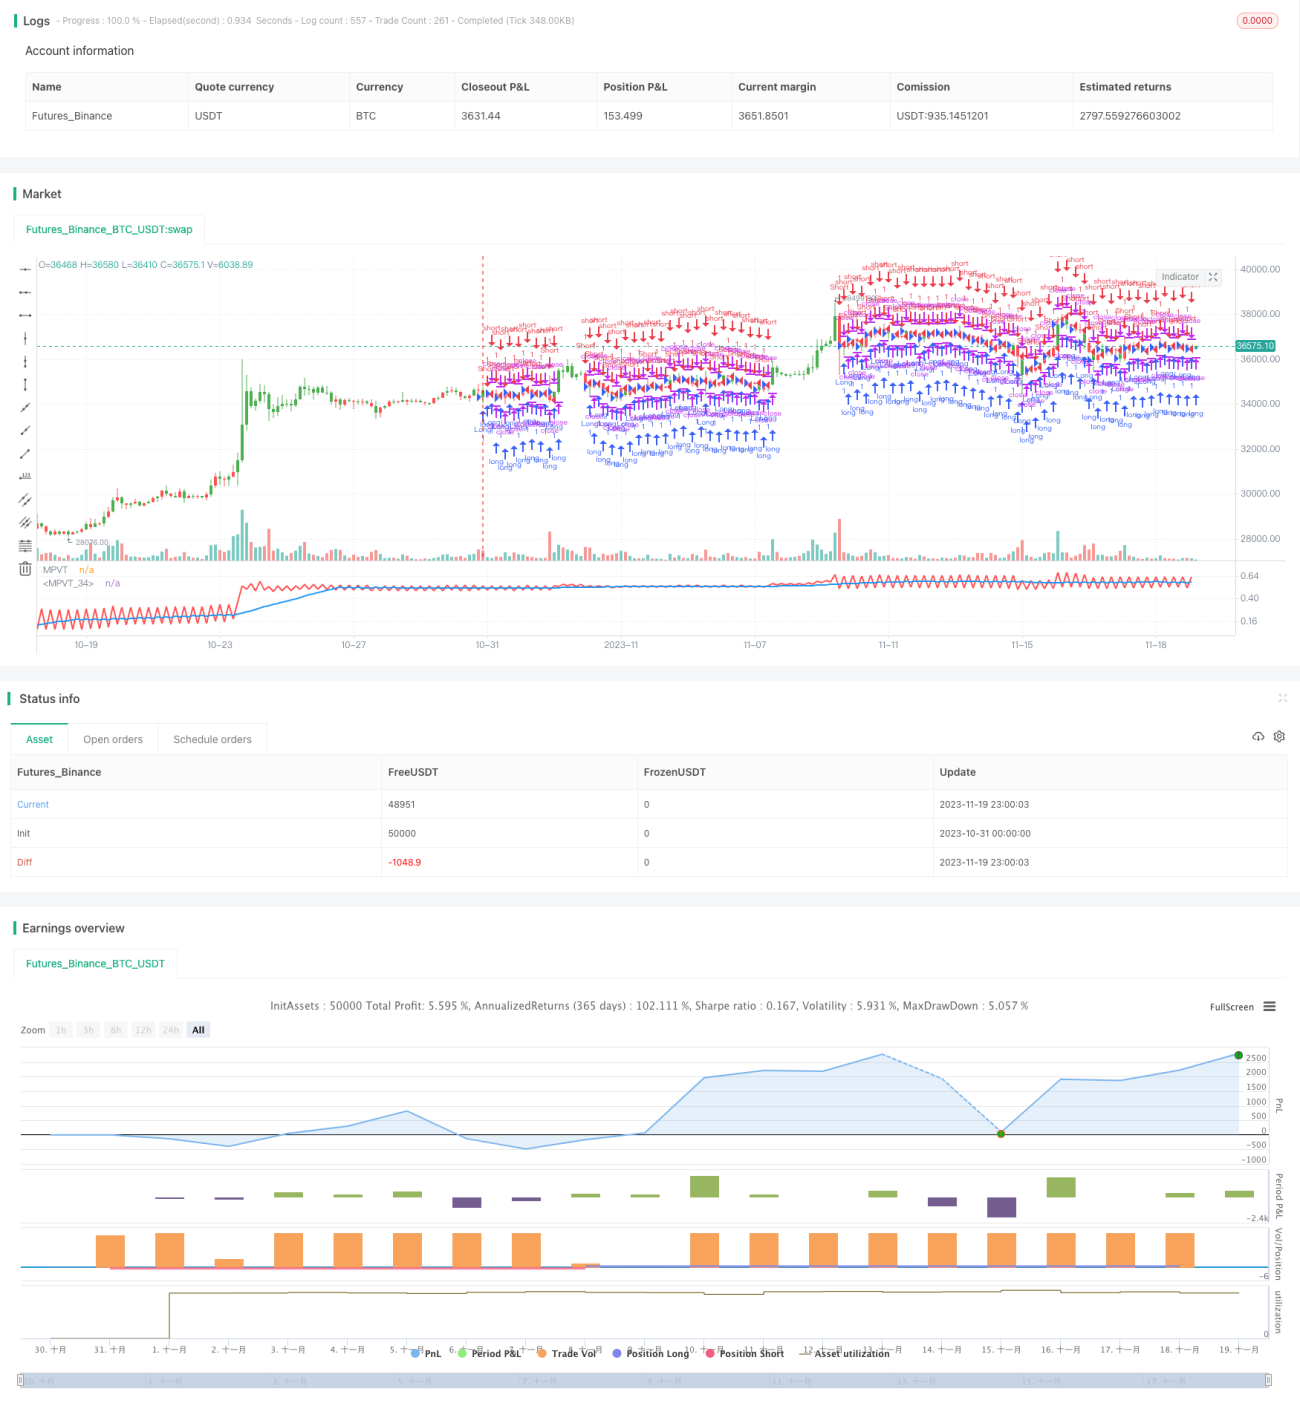
/*backtest
start: 2023-10-31 00:00:00
end: 2023-11-20 00:00:00
period: 3h
basePeriod: 15m
exchanges: [{"eid":"Futures_Binance","currency":"BTC_USDT"}]
*/

//@version=2
////////////////////////////////////////////////////////////
//  Copyright by HPotter v1.0 20/07/2018
// The related article is copyrighted material from- 1