Moving Average Line Reverse Crossover Strategy

Author: ChaoZhang, Date: 2023-12-01 16:52:13
Tags:

img

Overview

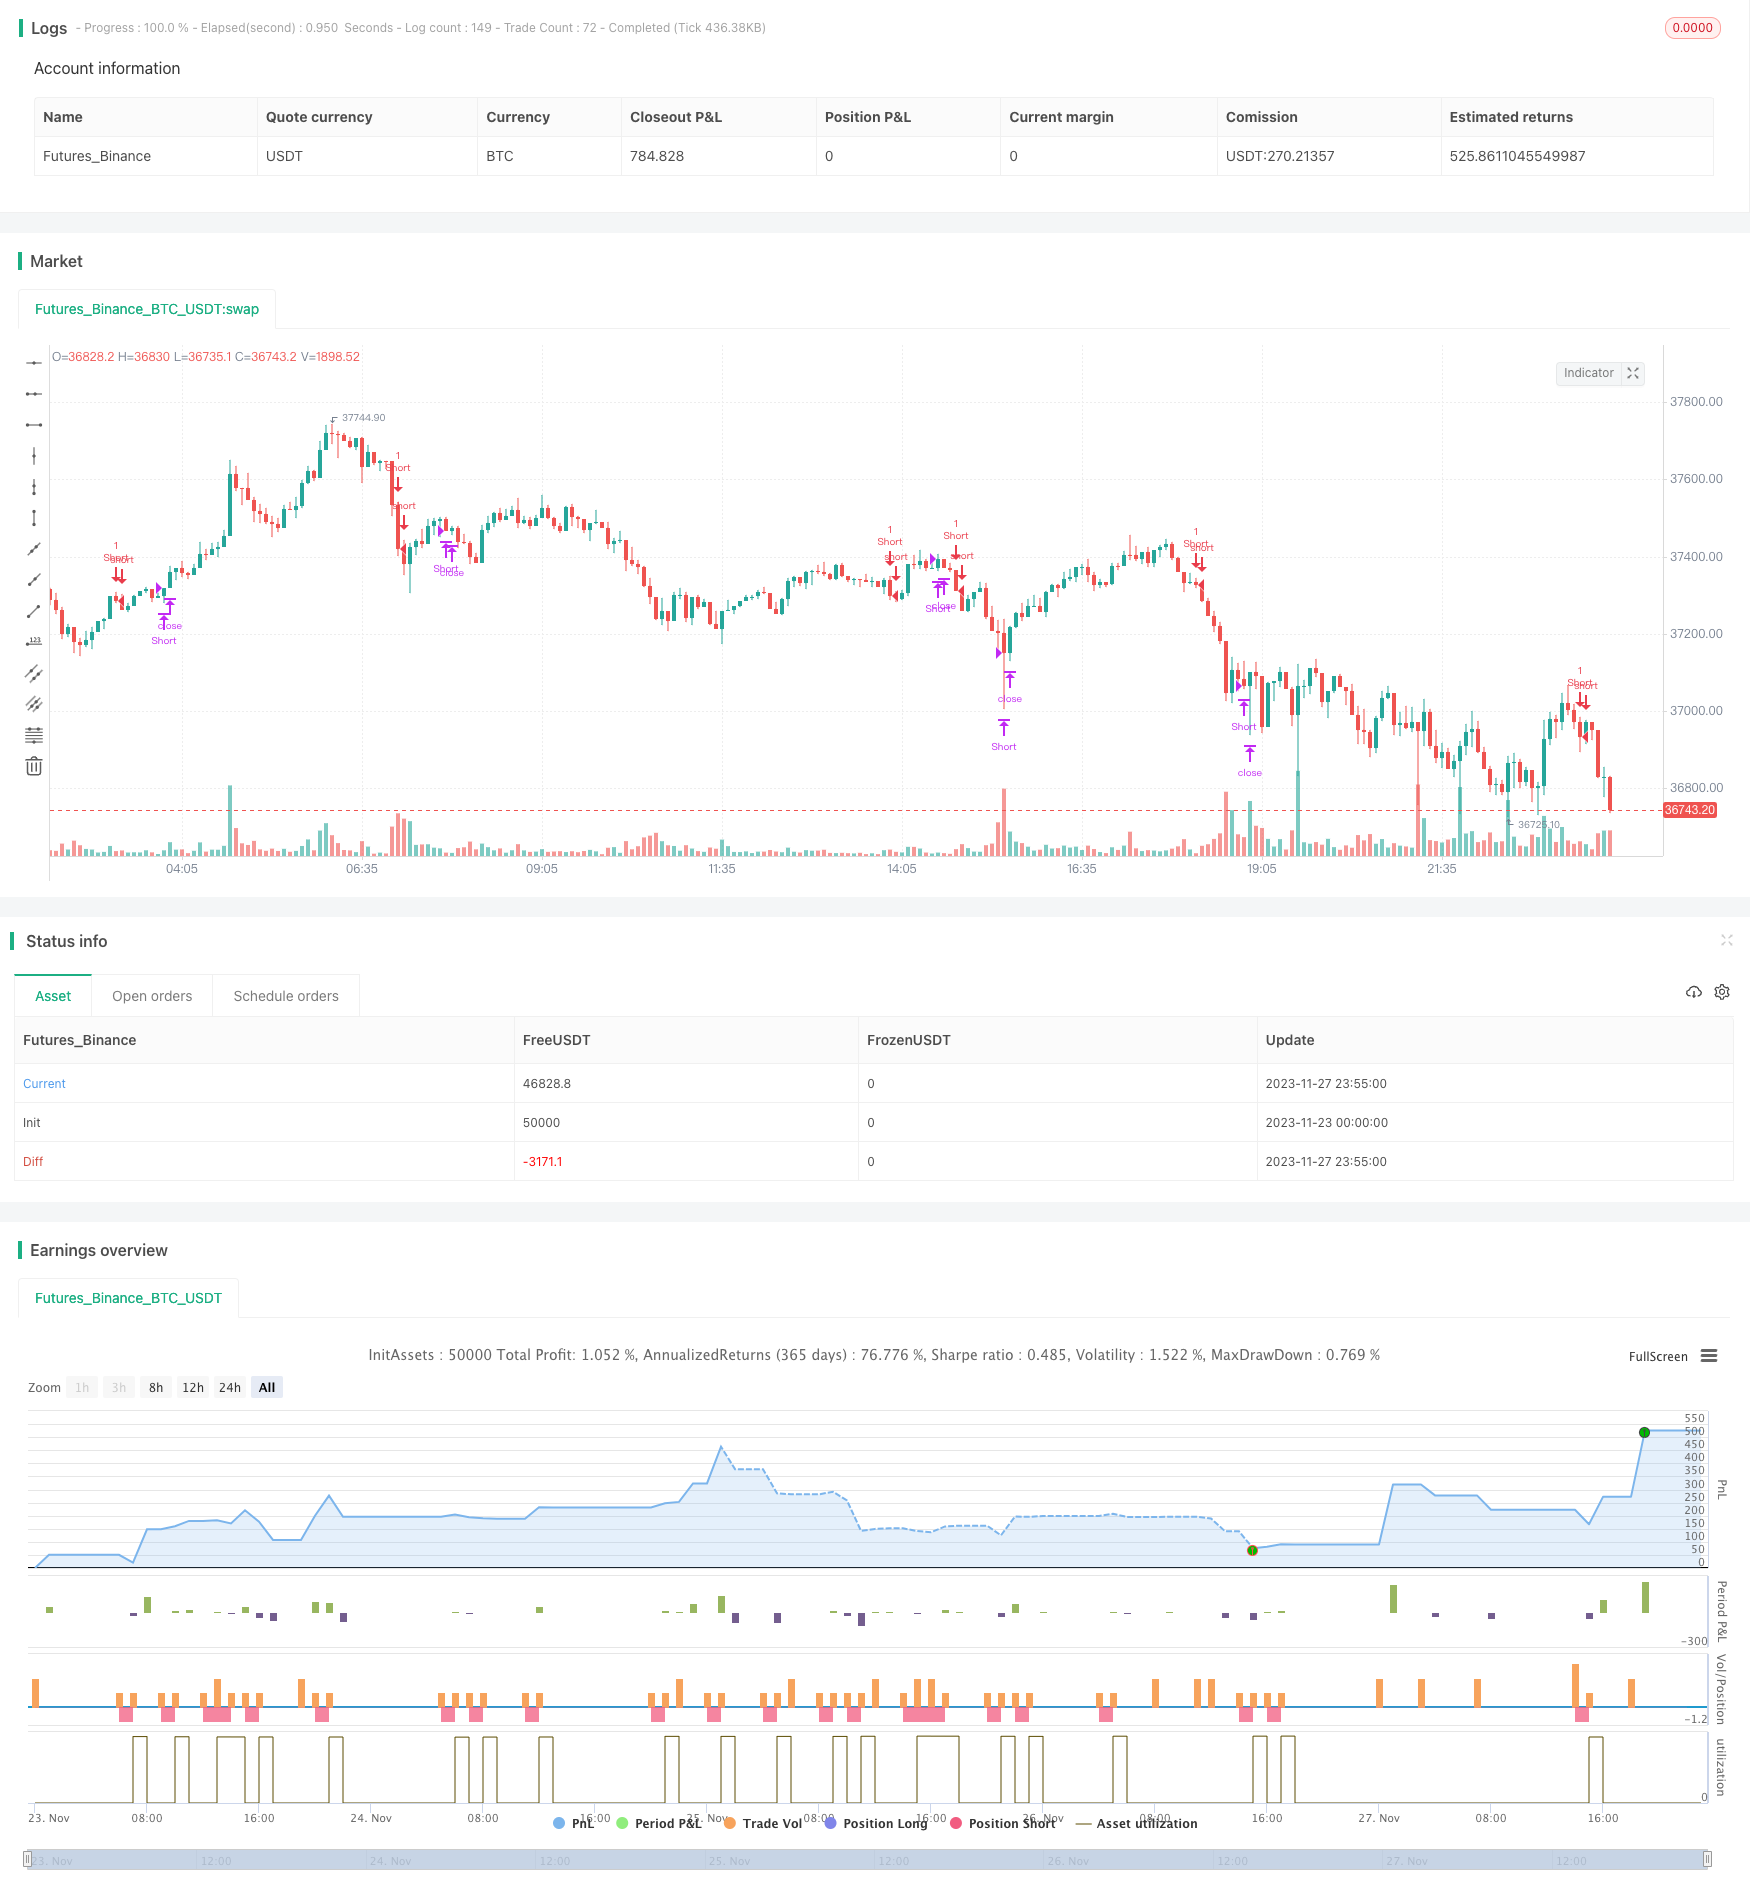
The moving average reverse crossover strategy is a technical analysis strategy. It utilizes the relationship between moving average lines and stock prices to determine when to enter or exit positions. Specifically, it goes short when the stock price crosses below the 45-day moving average line from top to bottom; closes the short position after holding it for 8 days; goes short again when the signal of the stock price crossing below the 45-day moving average reappears.

Principles

The core logic of this strategy is:

  1. Calculate the 45-day simple moving average (SMA)
  2. When the closing price crosses below the 45-day moving average from top to bottom, go short
  3. Close the position after holding the short position for 8 trading days
  4. If the crossover signal appears again, go short again

Specifically:

  1. Calculate the 45-day SMA first
  2. If not already in a short position and the price drop crossover SMA signal appears (close < SMA and previous close > previous SMA), go short
  3. If already held the short position for 8 days, close the position
  4. If not in a short position and the price crossover SMA signal appears again, and there is at least 8 days apart from last closing, go short again

Through this logic, we can go short when the stock price breaks through the moving average line significantly downward, and cut loss after a period of time.

Advantage Analysis

This strategy has the following advantages:

  1. The concept is simple and easy to understand and implement
  2. Utilize the signals of moving averages to judge trend reversals
  3. Has clear entry rules and stop loss rules
  4. Can filter out some false breakout signals

Compared with other strategies, this strategy is easy to understand and implement. At the same time, it utilizes the well-known technical indicator of moving average lines to determine price trends. When prices break through moving averages, it often means reversals in short-term trends. So some reversal opportunities can be captured.

In addition, the entry rules and fixed 8-day stop loss method in the strategy also make risk management clear. False breakouts are also filtered out to some extent. In general, this strategy is simple, practical and easy to master.

Risk Analysis

However, there are some risks to this strategy:

  1. Moving averages themselves have high lagging properties and cannot ensure that each crossover is the exact trend reversal point
  2. The 8-day holding period is relatively short and may not be able to continuously capture large moves
  3. There is no more confirmation for breakout signals, and some false breakouts may exist
  4. No profit taking points are set to lock in profits

Specifically, moving averages themselves lag prices, so their signals may not be timed precisely. Some breakouts may be temporary and fail to truly capture reversal points.

In addition, the 8-day holding period is relatively short. In major stock trends, such stop loss settings may be too aggressive to continuously capture larger reversals. It also increases the frequency of getting in and out of the market.

The strategy relies solely on the relationship between prices and moving averages to determine crossover signals. No additional confirmation indicators or criteria are configured to filter out signals. This makes false breakouts occur from time to time to some extent.

Finally, no profit taking points are set to lock in profits. Thus, profits may also be reduced before losses are stopped out.

Optimization Directions

Based on the above risk analysis, the strategy can be optimized in the following directions:

  1. Set up more confirmation indicators or conditions to filter out false breakouts

    For example, other technical indicators such as MACD and KD can be configured, and trend reversals can be identified only when they also show certain signals. Or increased trading volume can be configured as an auxiliary condition.

  2. Configure adaptive holding period

    For example, stop loss only after the price exceeds a certain fixed amplitude. Or stop loss when other indicators (such as MACD) give out signals.

  3. Set trailing stop profit

    That is, gradually move the profit taking point after the price rises a certain percentage to lock in profits.

  4. Optimize moving average parameters

    Try different parameter days and test to find the optimal parameters. Dual moving average systems can also be configured.

Through these optimizations, while maintaining the simplicity and effectiveness of the strategy, the signal quality can be improved and the probability of false breakouts can be reduced; more sufficient trend profits can be obtained; and stronger risk control capabilities can be achieved. Thus, better strategy performance may be achieved.

Conclusion

The moving average reverse crossover strategy is a very simple and practical short-term trading strategy. It utilizes the well-known technical indicator of moving averages to determine whether stock prices show short-term trend reversal signals. It has the advantages of easy to understand, simple to implement, controllable risks and so on. There are also some optimizable issues such as false breakouts and holding periods. By reasonably configuring technical indicators or parameters, the simplicity and validity of the strategy can be maintained while further enhancing the performance and risk control capabilities.


/*backtest
start: 2023-11-23 00:00:00
end: 2023-11-28 00:00:00
period: 5m
basePeriod: 1m
exchanges: [{"eid":"Futures_Binance","currency":"BTC_USDT"}]
*/

//@version=5
strategy("Moving Average Reverse Crossover Strategy", overlay=true)

// Calculate the 45-day moving average
ma_length = 45
ma = ta.sma(close, ma_length)

// Track position entry and entry bar
var bool in_short_position = na
var int entry_bar = na
var int exit_bar = na

// Entry condition: Close price crosses below the 45-day moving average to enter the short position
if (not in_short_position and ta.crossunder(close, ma) and not na(ma[1]) and close < ma and close[1] > ma[1])
    in_short_position := true
    entry_bar := bar_index

// Exit condition: Close the short position after holding for 8 trading days
if (in_short_position and bar_index - entry_bar >= 8)
    in_short_position := false
    exit_bar := bar_index

// Re-entry condition: Wait for price to cross below the 45-day moving average again
if (not in_short_position and ta.crossunder(close, ma) and not na(ma[1]) and close < ma and close[1] < ma[1] and (na(exit_bar) or bar_index - exit_bar >= 8))
    in_short_position := true
    entry_bar := bar_index

// Execute short entry and exit
if (in_short_position)
    strategy.entry("Short", strategy.short)

if (not in_short_position)
    strategy.close("Short")

More