Dual Moving Average Crossover Reversal Strategy

Overview
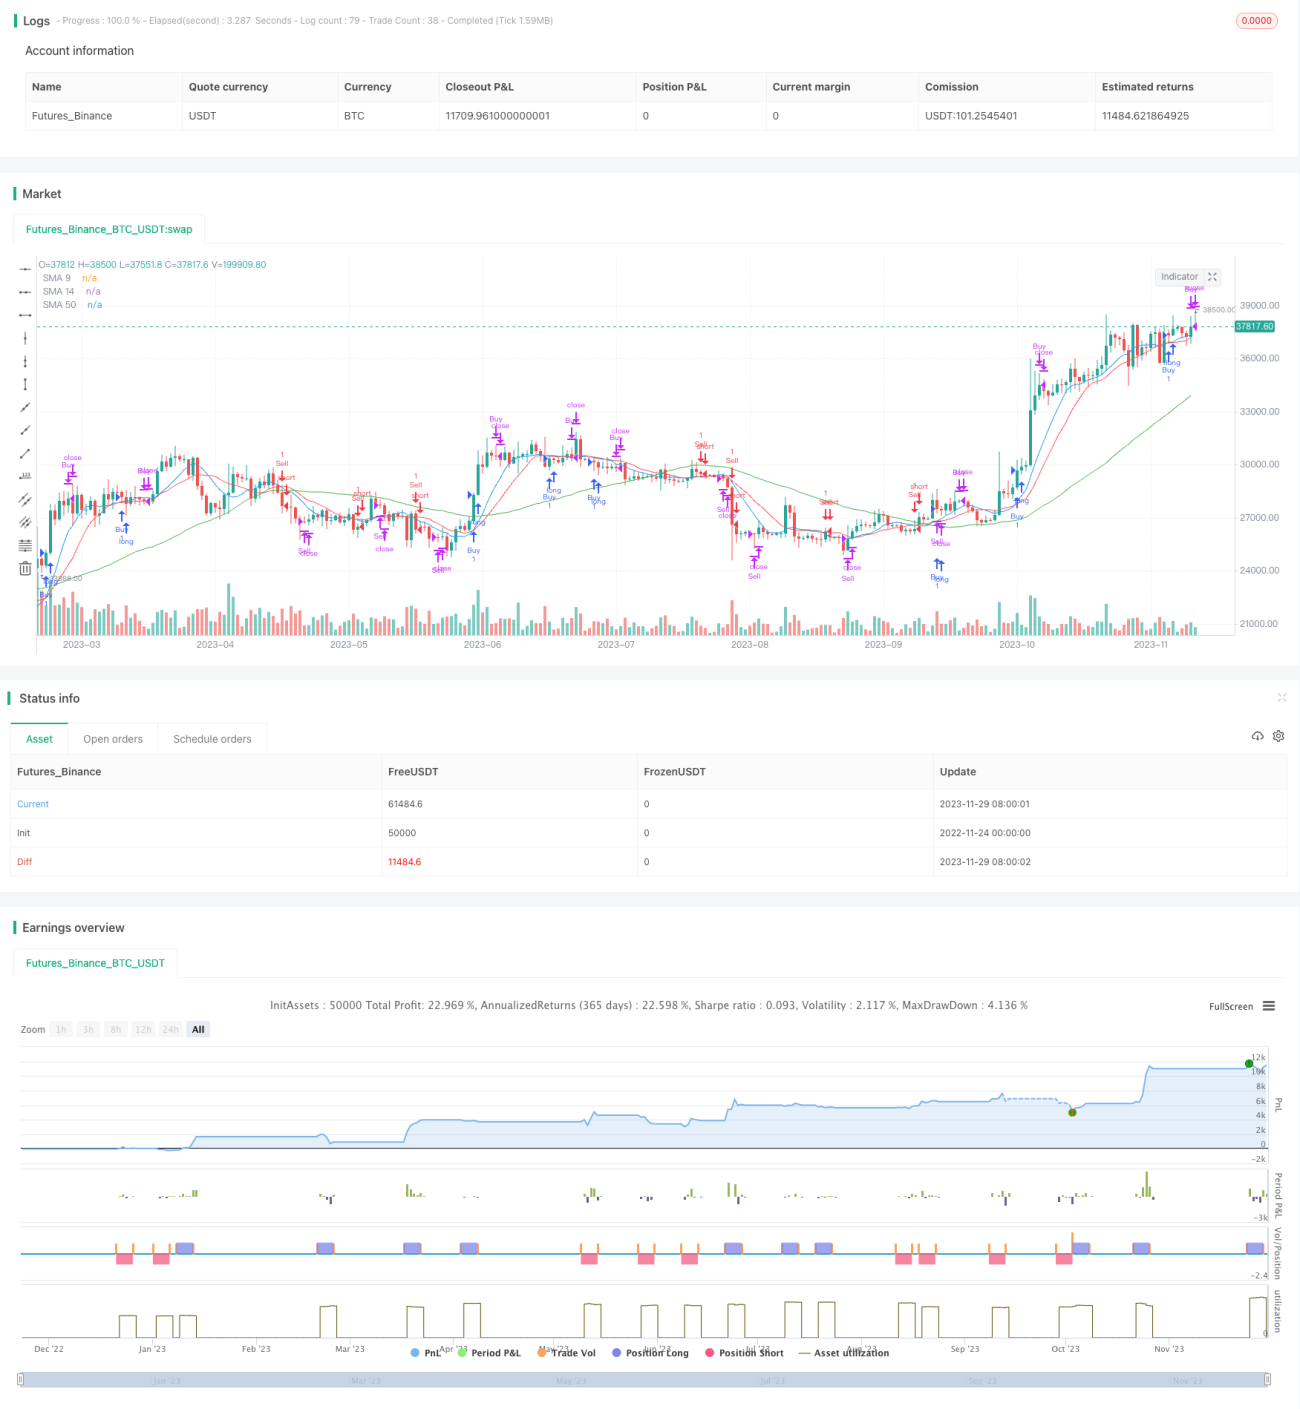
The Dual Moving Average Crossover Reversal strategy is a typical quantitative trading strategy that tracks trends. The strategy utilizes the crossover signals from the 9-day line and 14-day line in the dual moving average indicator to construct buy and sell signals. It buys when the 9-day line breaks through the 14-day line from below to form a golden cross, and sells when the 9-day line breaks through the 14-day line from above to form a death cross. To filter false signals, the strategy also introduces the 50-day line indicator to determine if the price breaks through.
Strategy Principle
This strategy mainly trades based on the golden cross and death cross signals from the dual moving average indicator. In the dual moving averages, the 9-day line represents short-term trends, the 14-day line represents medium-term trends, and their crossover is an effective technical indicator for judging turns in market trends. When the short-term trend line breaks through the medium-term trend line from below to form a golden cross, it indicates the short-term trend line is strengthening, which is a buy signal; when it breaks through from above to form a death cross, it indicates the short-term trend line is weakening, which is a sell signal.
In addition, the strategy also introduces the 50-day line to filter misleading signals. It only generates a buy when the price is above the 50-day line; and only generates a sell when the price is below the 50-day line. The 50-day line represents medium to long term trends. Only when medium to long term trends agree, short term operations are carried out.
The core logic is as follows:
pine
// Buy condition: 9-day line crosses above 14-day line and close price is above 50-day line
buyCondition = ta.crossover(sma9, sma14) and close > sma50
// Sell condition: 9-day line crosses below 14-day line and close price is below 50-day line
sellCondition = ta.crossunder(sma9, sma14) and close < sma50
Advantage Analysis
The advantages of the dual moving average strategy are obvious:
- Simple to understand and implement, suitable for beginners to learn.
- Go with the trend, avoid being trapped in range-bound markets.
- Use medium to long term indicators to filter misleading signals and avoid being fooled by short-term market noise.
- Can track trending markets and profit efficiently for extended periods.
Risk Analysis
The dual moving average strategy also has some risks:
- In extreme market conditions such as market crashes, there can be large drawdowns before a death cross forms. The strategy will hold onto large losing positions until a death cross triggers stops.
- In ranging markets, golden crosses and death crosses alternate, repeatedly opening and stopping out positions. This generates increased transaction costs.
To address the risks, optimizations such as below can be made:
- Introduce other indicators to quickly cut losses in crashing market conditions.
- Add more opening filters to avoid alternating crosses in ranging markets.
Optimization Directions
The dual moving average strategy can be optimized in several aspects:
- Parameter optimization. Adjust moving average periods, optimize indicator parameters.
- Further filter opening signals. Incorporate more indicators to judge market conditions and avoid false signals.
- Introduce stop loss mechanisms. Employ moving stop loss, penetration stop loss and other stop methods.
- Combine with other trading strategies such as volume and volatility strategies.
- Appropriately employ leverage to improve operational efficiency.
Summary
The dual moving average strategy is generally an efficient profit-generating strategy. It can profit by following trends continuously. At the same time, it has certain risks and needs further improvement. By optimizing parameters, stop methods and strategy combinations, the effects of this strategy can be further enhanced.
- 1