Oscillation Positioning Breakthrough Strategy with Multiple Indicators

Author: ChaoZhang, Date: 2023-12-01 17:49:34
Tags:

img

Overview

This strategy combines multiple indicators including STOCH.RSI, RSI, Dual Strategy, CM Williams Indicator and Money Flow Index (MFI) to accurately locate market fluctuations and looking for opportunities to long/short. It can generate trading signals when stock prices approach support or resistance levels. By integrating the advantages of multiple indicators and cross validation, this strategy can effectively reduce false signals and enhance reliability.

Strategy Logic

  1. STOCH.RSI combines the strengths of Stochastic Oscillator and Relative Strength Index (RSI), displaying overbought/oversold levels to detect reversal opportunities.

  2. RSI judges overbought/oversold conditions as an auxiliary confirmation.

  3. Dual Strategy determines crossovers between Stoch and RSI to generate trading signals.

  4. CM Williams Indicator calculates percentile bands. Bouncing off the bands represents market reversal, assisting judgement of fluctuations and reversals.

  5. Money Flow Index (MFI) judges fund flows, validating signals together with Stoch.RSI and RSI to improve quality.

In summary, by combining Stoch.RSI, RSI, Dual Strategy, CM Williams and MFI, this strategy can effectively determine overbought/oversold levels, locate reversal points and generate quality signals. Cross validation by multiple indicators improves reliability and reduces false signals.

Advantage Analysis

The main advantages of this strategy include:

  1. Multiple indicators combination improves signal quality by validation and reduces false signals.

  2. STOCH.RSI, RSI and MFI effectively spot overbought/oversold zones and market turning points.

  3. CM Williams calculates percentile bands to assist judging market fluctuations and reversals.

  4. Dual Strategy generates simple trading signals that are easy to follow.

  5. Highly customizable with a wide range of optimizable parameters adaptable to different markets.

Risk Analysis

Some risks to note:

  1. Complex multi-indicator computations demand high computing power, unsuitable for high frequency trading.

  2. Improper parameter tuning could deteriorate signal quality. Parameters should suit personal style.

  3. Reversal signals may lag. More indicators could assist trend judgment.

  4. High trading frequency may lead to poor capital utilization.

Solutions:

  1. Use powerful terminals and optimize parameters.

  2. Backtest extensively to find optimal personal parameters.

  3. Add more indicators to determine trends in advance.

  4. Optimize risk control mechanisms like stop loss to limit loss per trade.

Optimization Directions

This strategy can be improved in the following aspects:

  1. Optimize indicator parameters to find the optimal combination.

  2. Add indicators like volume and profit factor to enhance stock selection.

  3. Incorporate more trend lines, Bollinger Bands etc. to forecast support/resistance levels.

  4. Add stop loss, market entry filters to control risk.

  5. Parameters vary for different products and timeframes based on characteristics.

Conclusion

This strategy locates market reversals by accurately combining multiple indicators including STOCH.RSI, RSI, Dual Strategy, CM Williams and MFI. Cross validation improves signal quality and reduces false signals. Further enhancements like parameter optimization and additional filters can make it a stable, practical trading system.
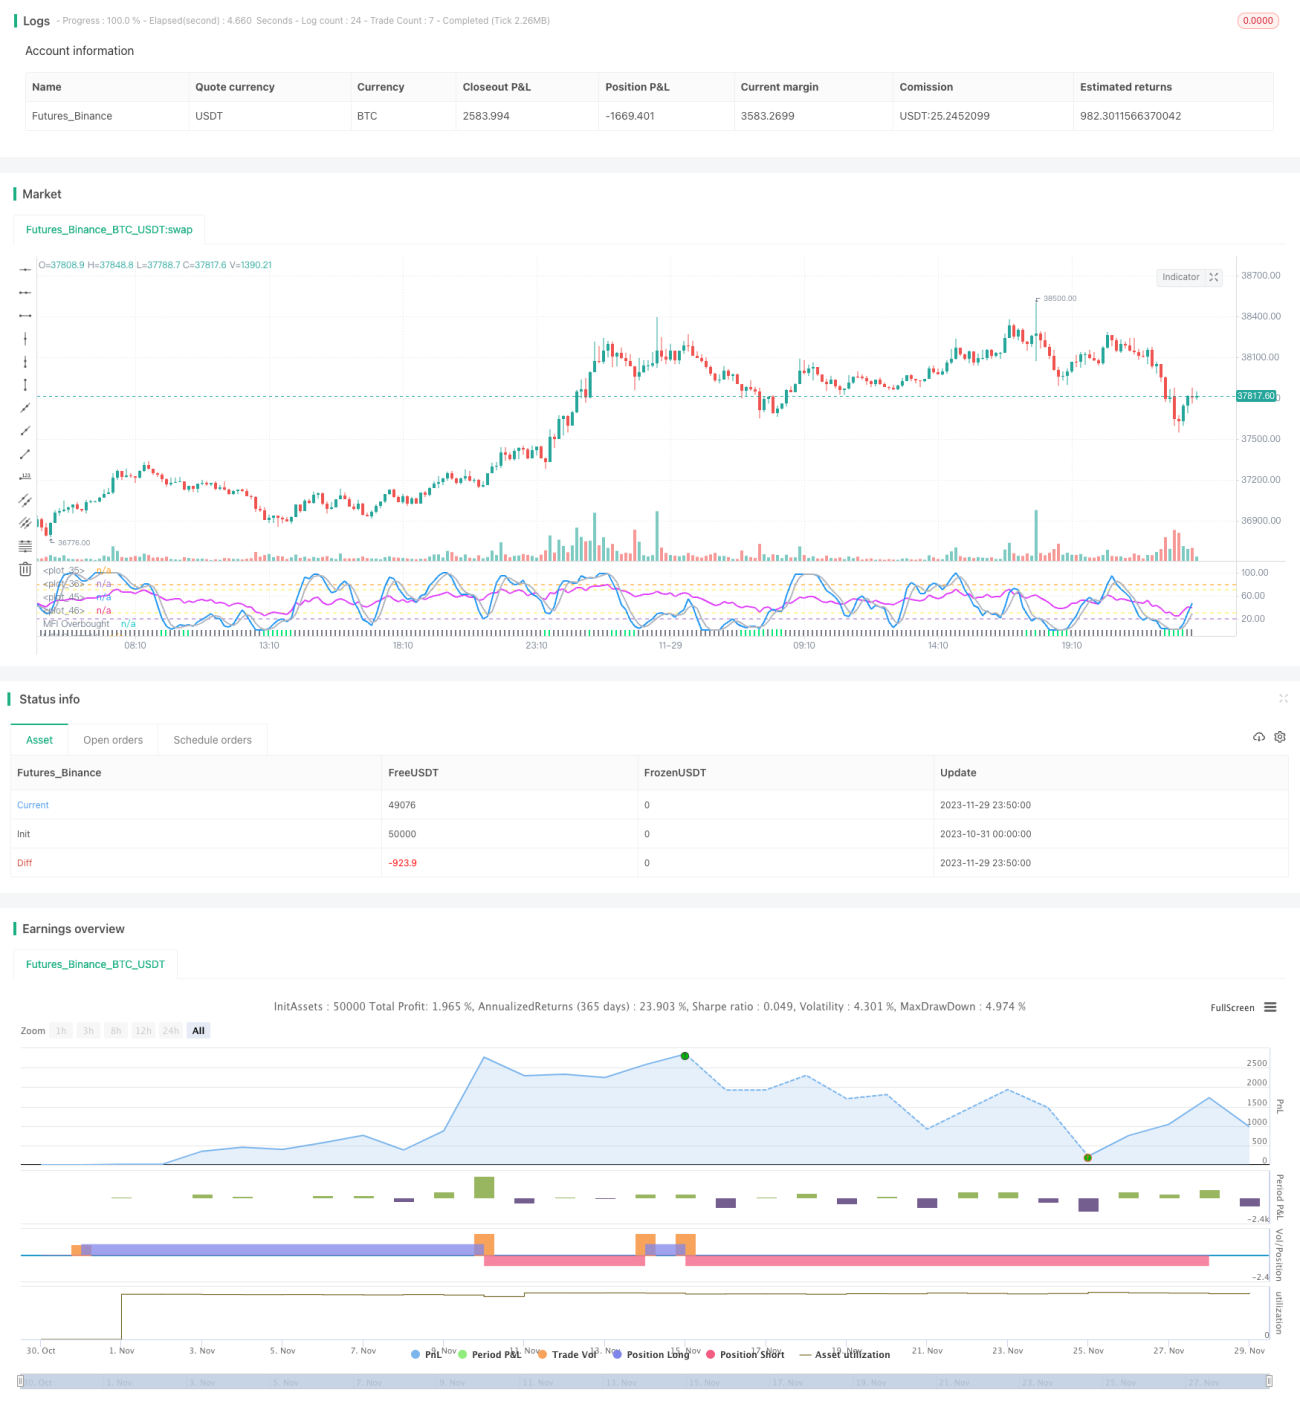

/*backtest
start: 2023-10-31 00:00:00
end: 2023-11-30 00:00:00
period: 10m
basePeriod: 1m
exchanges: [{"eid":"Futures_Binance","currency":"BTC_USDT"}]
*/


     //////////////////////////////////////////////////////////////////////////
    ////  STOCHASTIC_RSI+RSI+DOUBLE_STRATEGY+CM_WILLIAMS_VIX_FIX+MFI  ////////
   //////////////////////////////////////////////////////////////////////////


//  This is a simple combination of integrated and published scripts, useful 
//  if you don't have a PRO account and want to bypass the 3 indicators limit. 
//  It includes:
//  1) Stoch.RSI
//  2) Relative strenght index (RSI)
//  3) Stochastic + RSI, Double Strategy (by ChartArt)
//  4) CM_Williams_Vix_Fix Finds Market Bottoms (by ChrisMoody)
//  5) Monetary Flow Index (MFI)
//  For more details about 3) and 4) check the original scripts.


//@version=3
// @author GianlucaBezziccheri

strategy(title="Stoch.RSI+RSI+DoubleStrategy+CMWilliamsVixFix+MFI", shorttitle="Stoch.RSI+RSI+DoubleStrategy+CMWilliamsVixFix+MFI")


///STOCH.RSI///
smoothK = input(3, minval=1, title="Stochastic %K Smoothing")
smoothD = input(3, minval=1, title="Stochastic %K Moving Average")
lengthRSI = input(14, minval=1, title="RSI Lenght")
lengthStoch = input(14, minval=1, title="Stochastic Lenght")
RSIprice = close
rsi1 = rsi(RSIprice, lengthRSI)
k = sma(stoch(rsi1, rsi1, rsi1, lengthStoch), smoothK)
d = sma(k, smoothD)
plot(k, color=blue, linewidth=2)
plot(d, color=silver, linewidth=2)
h0 = hline(80)
h1 = hline(20)
fill(h0, h1, color=purple, transp=78)


///RSI///
up = rma(max(change(RSIprice), 0), lengthRSI)
down = rma(-min(change(RSIprice), 0), lengthRSI)
rsi2 = down == 0 ? 100 : up == 0 ? 0 : 100 - (100 / (1 + up / down))
plot(rsi2, color=fuchsia, linewidth=2)
band0 = hline(70)
band1 = hline(30)
fill(band0, band1, color=purple, transp=100)


///OVERBOUGHT-OVERSOLD STRATEGY///
StochOverBought = input(80, title="Stochastic RSI overbought")
StochOverSold = input(20, title="Stochastic RSI oversold")
ks = sma(stoch(close, high, low, lengthStoch), smoothK)
ds = sma(k, smoothD)
RSIOverBought = input( 70  , title="RSI overbought")
RSIOverSold = input( 30  , title="RSI oversold")
vrsi = rsi(RSIprice, lengthRSI)
if (not na(ks) and not na(ds))
    if (crossover(ks,ds) and k < StochOverSold)
        if (not na(vrsi)) and (crossover(vrsi, RSIOverSold))
            strategy.entry("LONG", strategy.long, comment="LONG")
if (crossunder(ks,ds) and ks > StochOverBought)
    if (crossunder(vrsi, RSIOverBought))
        strategy.entry("SHORT", strategy.short, comment="SHORT")
 
 
///CM WILLIAMS VIX FIX///
pd = input(22, title="LookBack Period Standard Deviation High")
bbl = input(20, title="Bollinger Band Length")
mult = input(2.0    , minval=1, maxval=5, title="Bollinger Band Standard Devaition Up")
lb = input(50  , title="Look Back Period Percentile High")
ph = input(.85, title="Highest Percentile - 0.90=90%, 0.95=95%, 0.99=99%")
pl = input(1.01, title="Lowest Percentile - 1.10=90%, 1.05=95%, 1.01=99%")
hp = input(false, title="Show High Range (Based on Percentile and LookBack Period)?")
sd = input(false, title="Show Standard Deviation Line?")
wvf = ((highest(close, pd)-low)/(highest(close, pd)))*100
sDev = mult * stdev(wvf, bbl)
midLine = sma(wvf, bbl)
lowerBand = midLine - sDev
upperBand = midLine + sDev
rangeHigh = (highest(wvf, lb)) * ph
rangeLow = (lowest(wvf, lb)) * pl
col = wvf >= upperBand or wvf >= rangeHigh ? lime : gray
plot(hp and rangeHigh ? rangeHigh : na, title="Range High Percentile", style=line, linewidth=4, color=orange)
plot(hp and rangeLow ? rangeLow : na, title="Range High Percentile", style=line, linewidth=4, color=orange)
plot(wvf, title="Williams Vix Fix", style=columns, linewidth = 4, color=col, transp=85)
plot(sd and upperBand ? upperBand : na, title="Upper Band", style=line, linewidth = 3, color=aqua)


///MONETARY FLOW INDEX
length4 = input(title="MFI Length", defval=14, minval=1, maxval=2000)
src4 = hlc3
upper4 = sum(volume * (change(src4) <= 0 ? 0 : src4), length4)
lower4 = sum(volume * (change(src4) >= 0 ? 0 : src4), length4)
mf4 = rsi(upper4, lower4)
plot(mf4, color=yellow, style=line, linewidth=2, title="Monetary Flow Index")
overbought=hline(70, title="MFI Overbought", color=yellow)
oversold=hline(30, title="MFI Oversold", color=yellow)
fill(overbought, oversold, color=#9915ff, transp=100)

More