资源加载中... loading...

Dual-directional Trading Strategy Based on RSI and STOCH RSI

Author: ChaoZhang, Date: 2023-12-01 18:06:23
Tags:

img

Overview

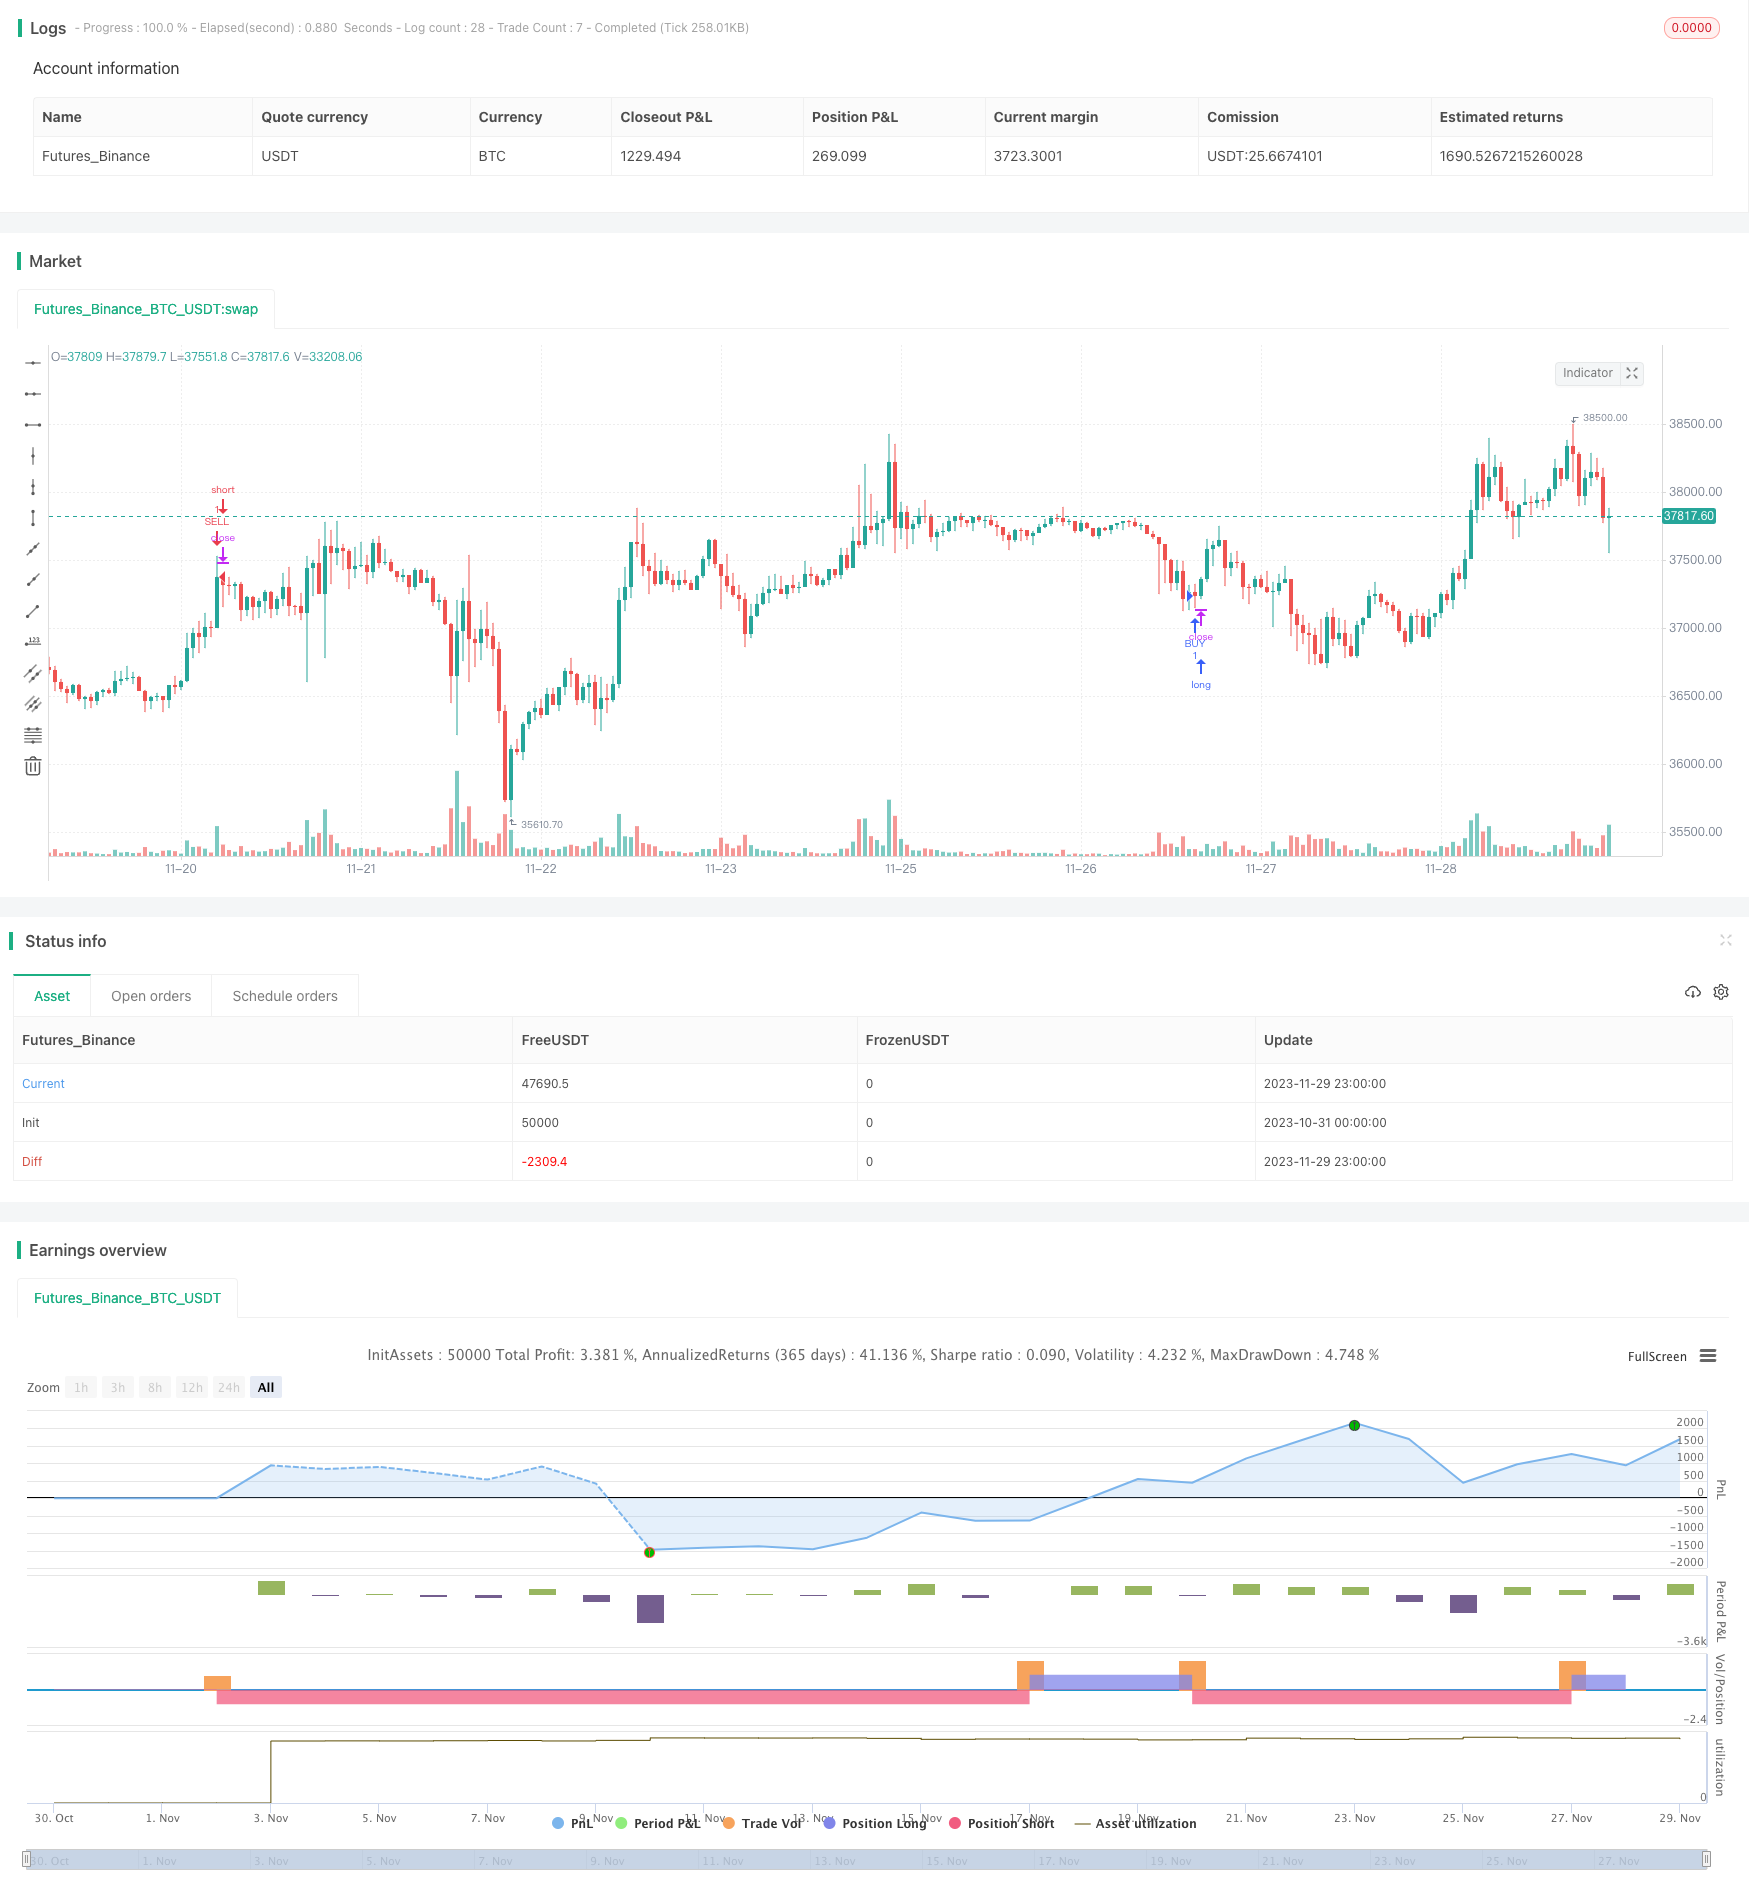
This strategy combines the powerful Relative Strength Index (RSI) and Stoch RSI technical indicators to implement a relatively stable and reliable dual-directional trading strategy. When the RSI indicator shows overbought or oversold signals and the Stoch RSI generates golden cross and death cross trading signals, the strategy will enter long or short positions.

Strategy Logic

This strategy is mainly based on the RSI and Stoch RSI indicators. RSI is used to determine whether the market is overbought or oversold. Stoch RSI is used to generate specific trading signals.

Firstly, RSI judges whether the market is overbought or oversold. If RSI is above the overbought line, the market is considered overbought. If RSI is below the oversold line, the market is considered oversold.

Secondly, Stoch RSI generates trading signals. When the fast line crosses above the slow line from below, a buy signal is generated. When the fast line crosses below the slow line from above, a sell signal is generated.

Finally, the strategy will only enter the market when RSI shows overbought/oversold conditions and Stoch RSI generates signals at the same time. The long signal is RSI oversold and Stoch RSI golden cross, while the short signal is RSI overbought and Stoch RSI death cross.

Advantage Analysis

The strategy combines the advantages of both RSI and Stoch RSI indicators, taking into account both overall market trends and detailed changes to generate more reliable trading signals, avoiding unnecessary false signals.

RSI can effectively determine whether the market is overbought or oversold, avoiding chasing tops and bottoms. Stoch RSI examines the momentum change of RSI to capture turning points in a timely manner. The combination ensures both the reliability of trading signals and proper entry timing.

In addition, time and price filters are added to further reduce the probability of erroneous trades and enhance the robustness of the whole strategy.

Risk Analysis

The strategy relies mainly on RSI and Stoch RSI, which are sensitive to market changes. This may result in frequent false signals and divergence between indicators, leading to high trading frequency and unstable profits.

To mitigate such risks, parameters of RSI and Stoch RSI can be adjusted to better fit market characteristics, and more filters can be added. Verification with other indicators should also be considered before taking signals from one single indicator.

Optimization Directions

The strategy can be further optimized in the following aspects:

  1. Add moving stop loss to lock in profits and reduce losses.

  2. Optimize RSI and Stoch RSI parameters to suit different periods and products.

  3. Add more filters like larger time frames and lower trading frequency.

  4. Incorporate other indicators for signal verification to avoid errors.

  5. Backtest optimization for the best parameter combination.

Conclusion

The strategy leverages the strengths of both RSI and Stoch RSI to establish a dual-directional trading framework, providing more comprehensive and reliable signal generation compared to using a single indicator, avoiding many unnecessary false signals. With further optimization, it can become a steady profitable quantitative trading strategy.


/*backtest
start: 2023-10-31 00:00:00
end: 2023-11-30 00:00:00
period: 1h
basePeriod: 15m
exchanges: [{"eid":"Futures_Binance","currency":"BTC_USDT"}]
*/

//@version= 2
strategy("RSI+STOCHRSI v2", overlay=true)
lengthrsi = input(10)
overSold = input( 20 )
overBought = input( 70 )
price = ohlc4
vrsi = rsi(price, lengthrsi)

smoothK = input(3, minval=1)
smoothD = input(3, minval=1)
lengthRSI = input(14, minval=1)
lengthStoch = input(14, minval=1)
src = input(close, title="RSI Source")

rsi1 = rsi(src, lengthRSI)
k = sma(stoch(rsi1, rsi1, rsi1, lengthStoch), smoothK)
d = sma(k, smoothD)
srsilow=input(20)
srsiup=input(80)


yearfrom = input(2018)
yearuntil =input(2039)
monthfrom =input(6)
monthuntil =input(12)
dayfrom=input(1)
dayuntil=input(31)


if (  ( crossover(d,k)) and ( (vrsi<overSold) or crossover(vrsi,overSold) )  and   year >= yearfrom and year <= yearuntil and month>=monthfrom and month <=monthuntil and dayofmonth>=dayfrom and dayofmonth < dayuntil) 
    strategy.entry("BUY", strategy.long, stop=close, oca_name="TREND",  comment="BUY")
    
else
    strategy.cancel(id="BUY")


if ( ( crossunder(d,k) ) and ( (vrsi >overBought) or crossunder(vrsi,overBought) ) and   year >= yearfrom and year <= yearuntil and month>=monthfrom and month <=monthuntil and dayofmonth>=dayfrom and dayofmonth < dayuntil ) 

    strategy.entry("SELL", strategy.short,stop=close, oca_name="TREND",  comment="SELL")
else
    strategy.cancel(id="SELL")


template: strategy.tpl:40:21: executing "strategy.tpl" at <.api.GetStrategyListByName>: wrong number of args for GetStrategyListByName: want 7 got 6