Dual Moving Average Crossover Strategy

Author: ChaoZhang, Date: 2023-12-01 18:18:16
Tags:

img

Overview

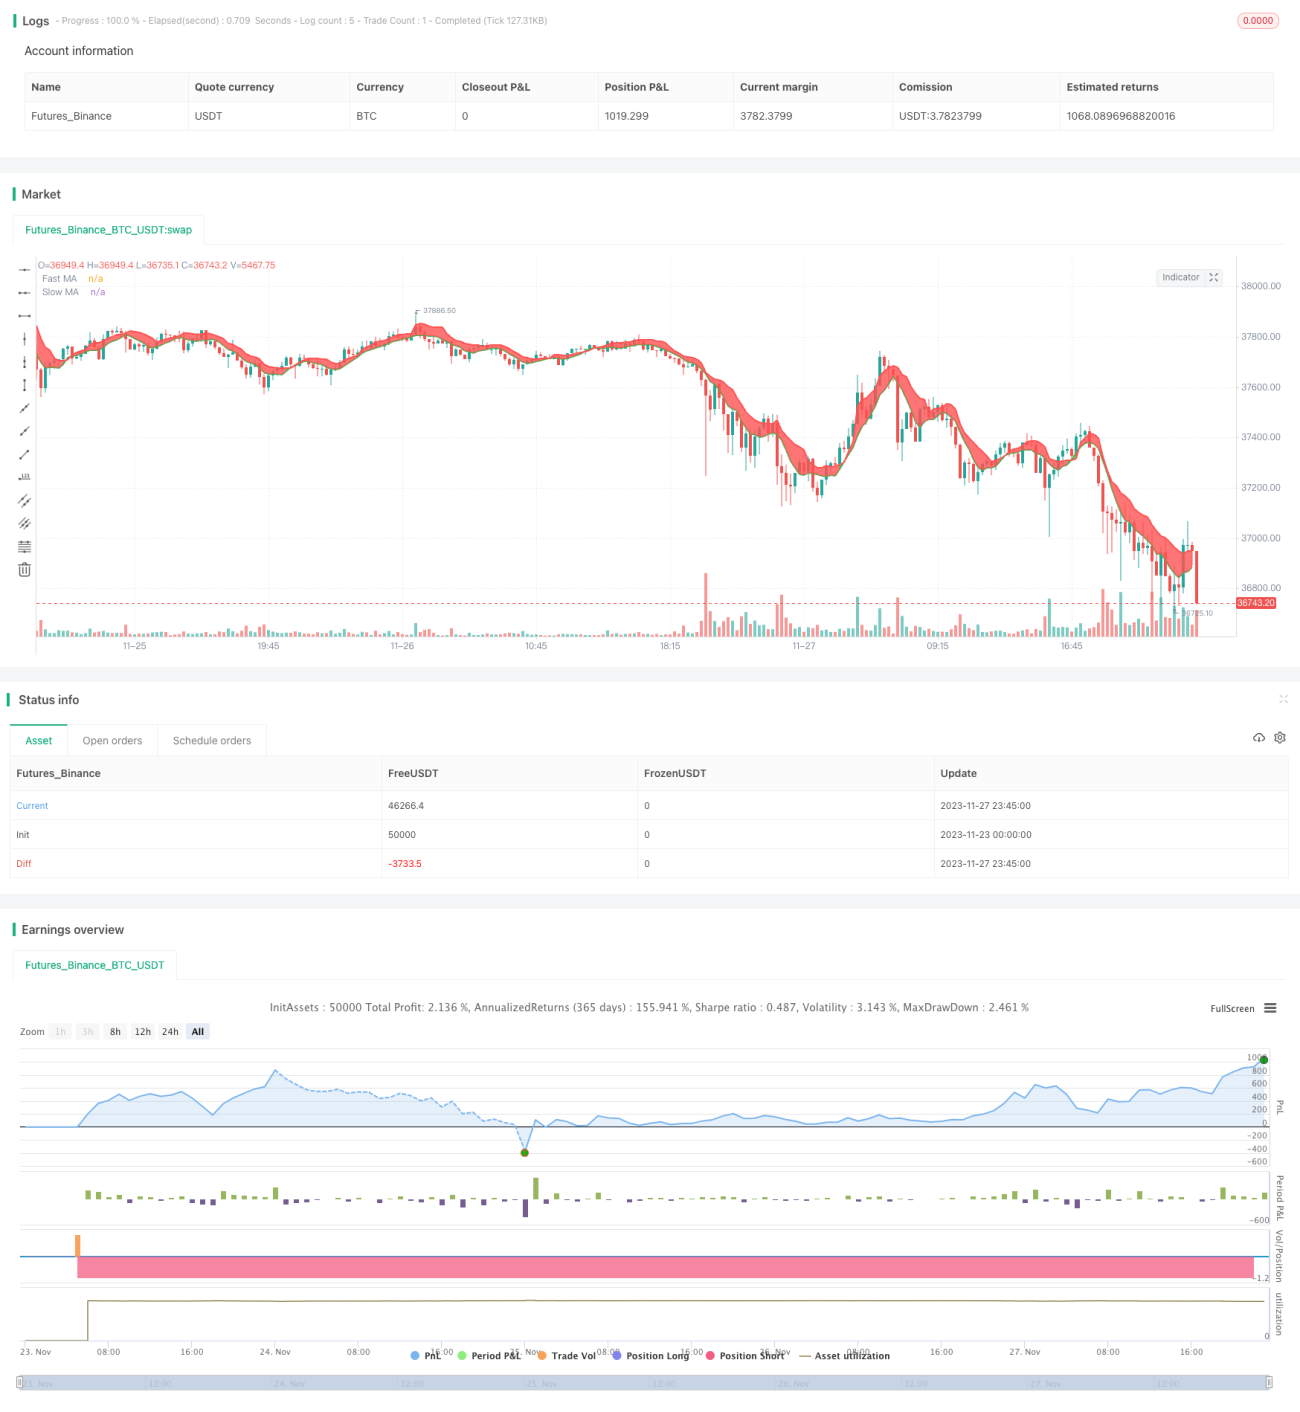
This strategy is based on the dual moving average crossover trend following system. It combines fast simple moving average (SMA) and slow weighted moving average (VWMA), and generates trading signals when the two lines cross each other.

When the fast SMA crosses above the slow VWMA, a buy signal is generated. When the fast SMA crosses below the slow VWMA, a sell signal is generated. The strategy also employs stop loss mechanism to control risks.

Strategy Logic

The core logic of this strategy lies in the dual moving average crossover system. Specifically, it utilizes the following technical indicators:

  1. Simple Moving Average (SMA): Arithmetic mean of closing prices over the past n days, reflecting recent average price.
  2. Weighted Moving Average (VWMA): Weighted mean of closing prices over the past n days, assigning higher weights to more recent prices, responding faster to price changes.

The fast SMA has a shorter lookback period to react swiftly to price changes, while the slow VWMA has a longer lookback period for smoothing. When short-term and long-term trends align in the same direction, the fast SMA crossing above the slow VWMA generates buy signals, while crossing below generates sell signals.

The strategy also sets up stop loss mechanisms. It cuts losses in time when price moves in unfavorable directions.

Advantage Analysis

  1. Responds swiftly in tracing market trend changes
  2. Good drawdown control with effective stop loss mechanisms
  3. Simple and intuitive, easy to understand and implement
  4. Optimizable parameters across varying market environments

Risk Analysis

  1. Dual MA strategies tend to give false signals in bull markets
  2. Inappropriate parameter tuning could lead to losses
  3. Occasional flash crashes could cause losses

Risk Management:

  1. Employ trend filtering indicators for confirmation
  2. Optimize parameter settings
  3. Adopt stop loss strategy to reasonably control single loss

Optimization Directions

The strategy can be enhanced in the following aspects:

  1. Incorporate other indicators like RSI, Bollinger Bands to increase signal accuracy
  2. Optimize length of moving averages across cycles
  3. Combine volume indicators, trade at points with significant capital flows
  4. Adjust parameters based on backtest results to find optimum
  5. Employ dynamic stop loss, adjusting stops based on market volatility

Conclusion

In conclusion, this is a very practical trend following strategy. It uses intuitive dual moving average crossovers to generate trading signals, capturing trend changes effectively with the coordination of fast and slow moving averages. The stop loss mechanism also ensures good risk control. With complementary indicators and parameter optimization, the strategy can achieve even better trading performance.


/*backtest
start: 2023-11-23 00:00:00
end: 2023-11-28 00:00:00
period: 15m
basePeriod: 5m
exchanges: [{"eid":"Futures_Binance","currency":"BTC_USDT"}]
*/

//@version=4
//strategy(title="Bitlinc Entry v0.1 VWMA / SMA / MRSI SQQQ 94M", overlay=true, initial_capital=10000, currency='USD')

strategy(title="Bitlinc Entry v0.1 VWMA / SMA / MRSI SQQQ 94M", overlay=true)

// Credit goes to this developer for the "Date Range Code"
// https://www.tradingview.com/script/62hUcP6O-How-To-Set-Backtest-Date-Range/

// === GENERAL INPUTS ===
// short ma
maFastSource   = input(defval = close, title = "Simple MA Source")
maFastLength   = input(defval = 6, title = "Simple MA Length", minval = 1)
// long ma
maSlowSource   = input(defval = high, title = "VW MA Source")
maSlowLength   = input(defval = 7, title = "VW MA Period", minval = 1)


// === SERIES SETUP ===
// a couple of ma's...
maFast = sma(maFastSource, maFastLength)
maSlow = vwma(maSlowSource, maSlowLength)


// === PLOTTING ===
fast = plot(maFast, title = "Fast MA", color = color.green, linewidth = 2, style = plot.style_line, transp = 30)
slow = plot(maSlow, title = "Slow MA", color = color.red, linewidth = 2, style = plot.style_line, transp = 30)

// === INPUT BACKTEST RANGE ===
FromMonth = input(defval = 1, title = "From Month", minval = 1, maxval = 12)
FromDay   = input(defval = 1, title = "From Day", minval = 1, maxval = 31)
FromYear  = input(defval = 2018, title = "From Year", minval = 2017)
ToMonth   = input(defval = 1, title = "To Month", minval = 1, maxval = 12)
ToDay     = input(defval = 1, title = "To Day", minval = 1, maxval = 31)
ToYear    = input(defval = 9999, title = "To Year", minval = 2017)

// === FUNCTION EXAMPLE ===
start     = timestamp(FromYear, FromMonth, FromDay, 00, 00)  // backtest start window
finish    = timestamp(ToYear, ToMonth, ToDay, 23, 59)        // backtest finish window
window()  => time >= start and time <= finish ? true : false // create function "within window of time"

// === LOGIC ===
enterLong = crossover(maFast, maSlow)
exitLong = crossover(maSlow, maFast)
//enterLong = crossover(maSlow, maFast)
//exitLong = crossover(maFast, maSlow)

// Entry //
strategy.entry(id="Long Entry", long=true, when=window() and enterLong)
strategy.entry(id="Short Entry", long=false, when=window() and exitLong)

// === FILL ====
fill(fast, slow, color = maFast > maSlow ? color.green : color.red)

// === MRSI ===
//
//

basis = rsi(close, input(50))

ma1 = ema(basis, input(2))
ma2 = ema(basis, input(27))

oversold = input(32.6)
overbought = input(63)

//plot(ma1, title="RSI EMA1", color=blue)
//plot(ma2, title="RSI EMA2", color=yellow)

obhist = ma1 >= overbought ? ma1 : overbought
oshist = ma1 <= oversold ? ma1 : oversold

//plot(obhist, title="Overbought Highligth", style=columns, color=color.maroon, histbase=overbought)
//plot(oshist, title="Oversold Highligth", style=columns, color=color.yellow, histbase=oversold)

//i1 = hline(oversold, title="Oversold Level", color=white)
//i2 = hline(overbought, title="Overbought Level", color=white)

//fill(i1, i2, color=olive, transp=100)

// === LOGIC ===
enterLongMrsi = crossover(ma1, oversold)
exitLongMrsi = crossover(ma1, overbought)

// Entry //
strategy.entry(id="MRSI Long Entry", long=true, when=window() and enterLongMrsi)
strategy.entry(id="MRSI Short Entry", long=false, when=window() and exitLongMrsi)

//hline(50, title="50 Level", color=white)

More