The Great Delight Multifactor Quantitative Strategy

Overview
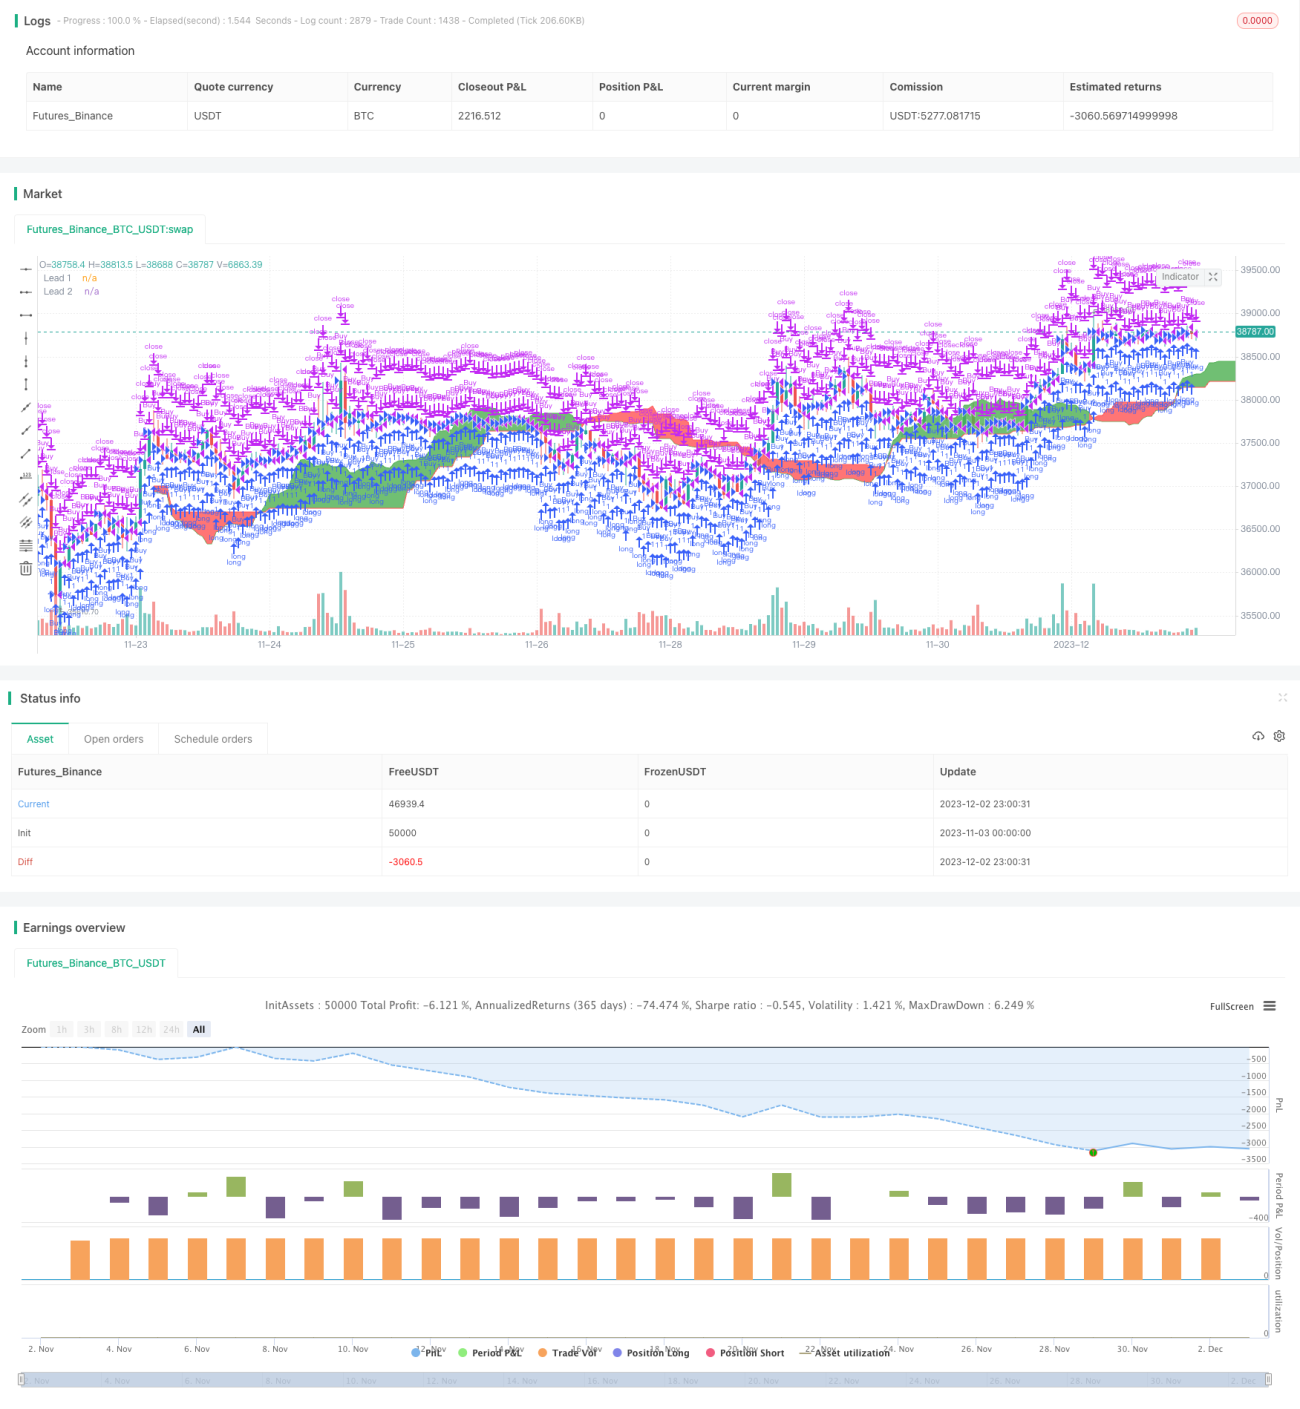
The Great Delight multifactor quantitative strategy combines multiple technical indicators, including moving averages, the MACD, and the Ichimoku cloud, as a trend-following long-term strategy. It mainly uses the 200-day simple moving average to determine the overall trend, and additional details from the 20-day exponential moving average, the MACD index, and the Ichimoku cloud to pinpoint specific entry and exit points.
By considering both long-term and short-term trends, as well as multiple-factor verification, this strategy can effectively filter noise trades caused by false breakouts. While pursuing high-quality opportunities, it also controls risks, making it suitable for experienced investors for medium-to-long-term holdings.
Strategy Principles
When the price is above the 200-day MA, the strategy believes the market is in a bull trend. As long as the 20-day MA and MACD indicators generate a buy signal at the same time, and the price is higher than the highest Ichimoku cloud price or inside the cloud, a buy signal is generated.
When the price breaks below the 200-day MA, the strategy determines a bear trend has begun. The signal requirements become stricter now: in addition to the 20-day MA and MACD buy signals, the Ichimoku cloud must also give a buy signal (green cloud or price above cloud top) before triggering a buy.
The sell signal logic is similar but reversed: in a bull market, a candle close below the cloud bottom or cloud flip triggers sell; in a bear market, enter the red cloud or 20-day MA and MACD sell signals triggers sell.
Advantage Analysis
The biggest advantage of this strategy lies in combining multiple long and short-term indicators to determine market situations, which can effectively filter out false signals. Specifically:
- The 200-day MA determines the overall trend to avoid counter-trend trades.
- The 20-day MA focuses on short-term dynamics to capture reversals.
- The MACD verifies trend changes.
- The Ichimoku cloud double checks to prevent wrong signals.
Through multi-layer verifications, the profitability rate can be greatly improved. In addition, the coordination between long and short-term indicators also makes the strategy suitable for both short-term and mid-long term operations.
Risk Analysis
The main risk of this strategy is the probability of multiple indicators giving wrong signals at the same time. Although highly unlikely in extreme conditions, it can still happen over prolonged use. The main counter measures are:
- Adjust parameters appropriately to find the optimal combination.
- Strict stop losses to quickly reverse direction after wrong signals. Can consider adding stops in live trading.
- Use futures hedging methods to lock in profits.
- Adjust position sizing according to major support areas.
Optimization Directions
The strategy can be optimized from the following aspects:
- Test different parameter combinations to find the optimum.
- Add a stop loss module for better risk control.
- Incorporate correlation indicators like rate of change to avoid chasing tops and bottoms.
- Introduce machine learning methods like neural networks to train indicator weighting.
- Verify robustness across different markets.
Conclusion
The Great Delight strategy filters out noise through scientific combinations of indicators, enabling persistent profitability while controlling risks. By considering both long-term trends and short-term opportunities, it is widely applicable in mid-long term investments. Further performance improvements can be expected through optimizations like parameters tuning, stop loss additions, and introducing machine learning.
- 1