TFO and ATR Based Trend Tracking Stop Loss Strategy

Overview
This strategy is designed based on Dr. John Ehlers' Trend Flex Oscillator (TFO) and Average True Range (ATR) indicators. It is suitable for bull markets and will open long positions when oversold price action appears to reverse. It typically closes positions within a few days unless caught in a bear market, in which case it holds on. This strategy simplifies backtesting by making parameters configurable, but backtest results should never be fully trusted.
Strategy Logic
This strategy combines the TFO and ATR indicators to determine entries and exits.
Entry conditions: When TFO drops below a threshold (indicating oversold levels) and TFO has risen from the previous bar (indicating TFO reversal upwards), and ATR is above a set volatility threshold (indicating increasing market volatility), long positions are opened.
Exit conditions: When TFO rises above a threshold (indicating overbought levels) and ATR is above a set threshold, all long positions are closed. In addition, a trailing stop loss exits all positions when price drops below the trailing stop level. Users can choose to allow the strategy to exit based on indicator signals or based solely on the stop loss.
The strategy allows up to 15 simultaneous long positions. Parameters can be adjusted for different timeframes.
Advantages
-
Combining trend and volatility analysis provides steady signals. TFO captures early trend reversal signals and ATR identifies surge in volatility.
-
Adjustable entry, exit and stop loss parameters provide flexibility. Users can optimize based on market conditions.
-
Built-in stop loss protects against extreme moves. Stop losses are essential in quant trading.
-
Support for pyramiding and partial exits allows profit compounding in bull markets.
Risks
-
Long only, no shorting mechanism. Cannot profit from falling markets. Severe bear markets can cause huge losses.
-
Poor parameter tuning can cause over trading or missed entries and exits. Extensive testing is needed to find optimal parameters.
-
In extreme moves, stop loss can fail and not prevent huge losses. A limitation of all stop loss strategies.
-
Backtest does not fully reflect live performance. Expect some deviation.
Enhancement Opportunities
-
A moving stop loss line can be added for timely exits and better downside protection.
-
Shorting mechanism can be added to allow profits during market drops when TFO reverses downwards and ATR is high enough.
-
More filters like volume change can reduce impacts of erratic price moves.
-
Different timeframes and parameters can be tested to find the best performing combination.
Conclusion
This strategy combines the strengths of trend and volatility analysis using TFO and ATR to determine market direction. Mechanisms like pyramiding, partial close and trailing stop loss allow profit compounding while controlling risk during bull markets. There is room for improvements via more indicators filters and parameter optimization. It achieves the basic goals of a quant strategy and merits further research and application.
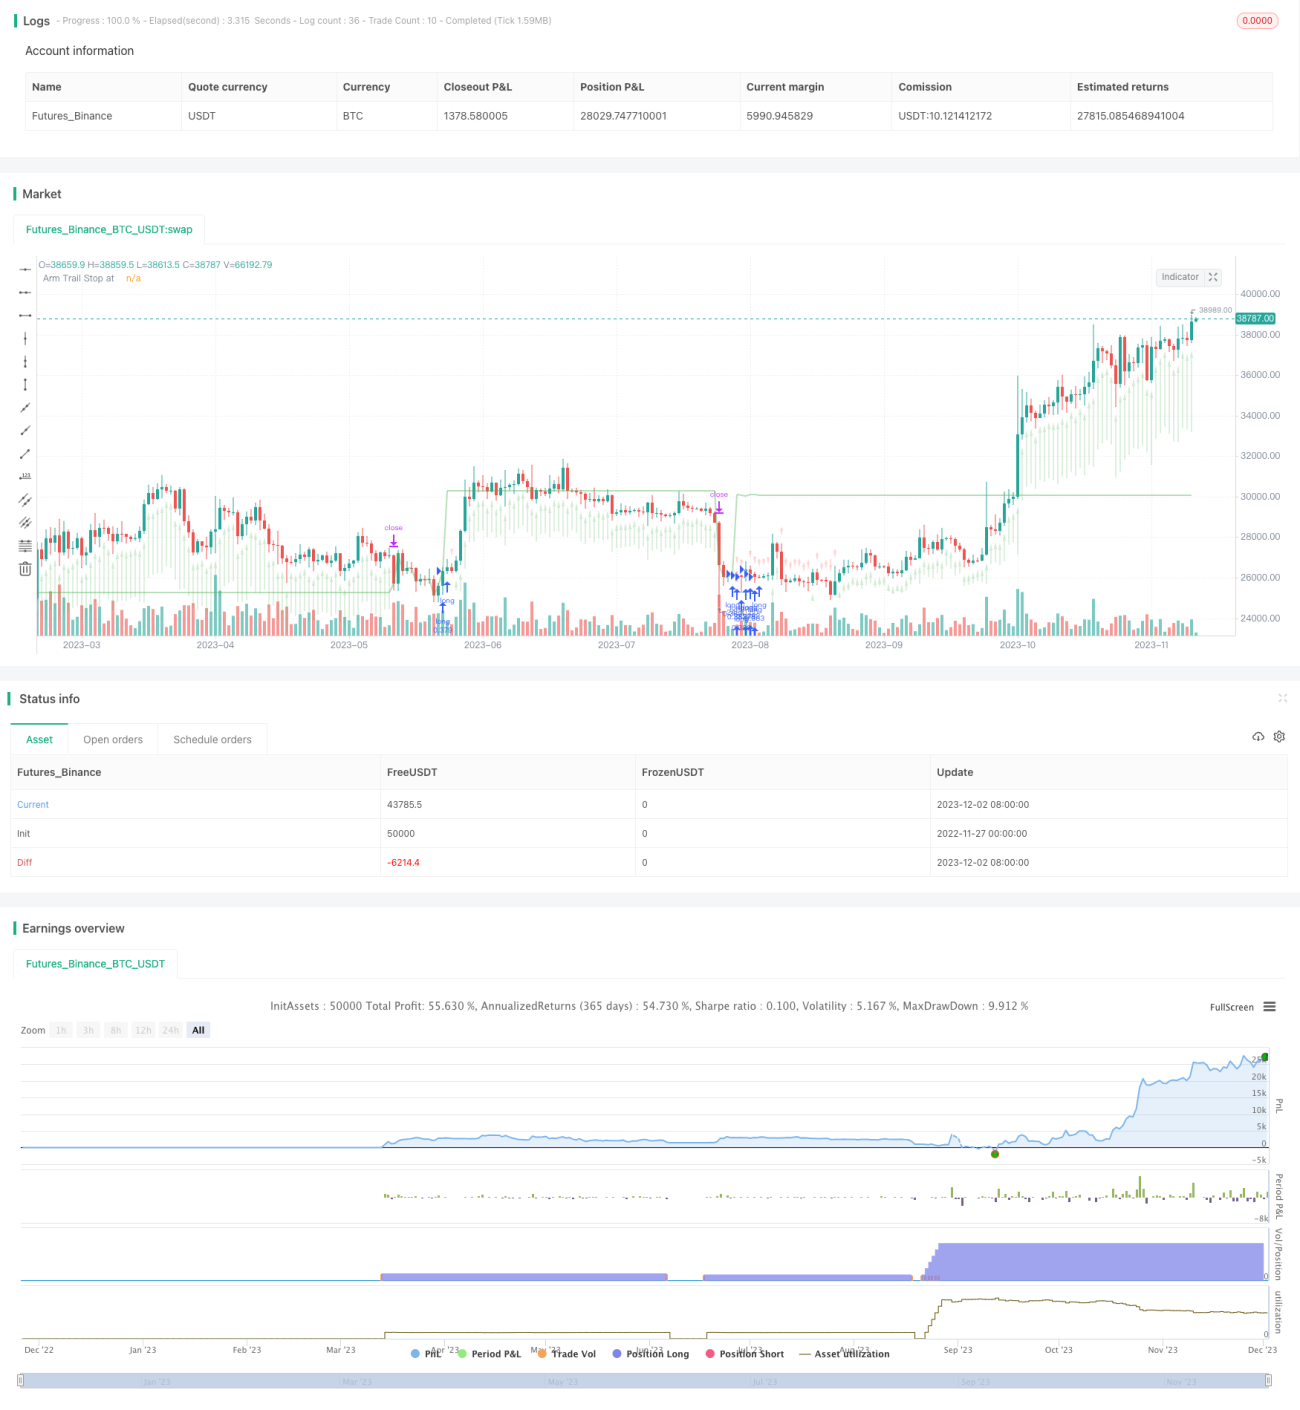
/*backtest
start: 2022-11-27 00:00:00
end: 2023-12-03 00:00:00
period: 1d
basePeriod: 1h
exchanges: [{"eid":"Futures_Binance","currency":"BTC_USDT"}]
*/

// This source code is subject to the terms of the Mozilla Public License 2.0 at https://mozilla.org/MPL/2.0/
// © Chart0bserver
//
// Open Source attributions:- 1