Adaptive Volatility Breakout Trading Strategy

1
Follow
1779
Followers
Overview
This strategy identifies market trends based on price breakthrough points and uses adaptive indicators to determine the overall trend in order to capture short-term price reversal opportunities. It generates buy/sell signals when prices break out of the baseline channel. The strategy is suitable for trading highly volatile cryptocurrencies.
Strategy Logic
- Identify extreme price points as channel boundaries. When prices hit new highs or lows, set those points as channel boundaries.
- Calculate the adaptive volatility MA indicator to determine the overall trend direction. Larger MA values indicate the market is currently in a volatile stage.
- Generate buy signals when prices break above the channel top, and sell signals when prices break below the channel bottom.
- Set stop loss points. Long position stop loss points are set at 1% below the entry price.
Advantage Analysis
- The price channel is adaptive and can accurately determine trend reversal points.
- The volatility indicator judges the overall trend and avoids missing the big picture in volatile markets.
- As a reversal strategy, it is suitable to capture short-term price bounces.
Risk Analysis
- In a sustained downtrend, multiple stop loss points may be triggered resulting in large losses.
- Frequent buy and sell trades in ranging markets increase transaction costs.
- Requires manual determination of entry times. Fully automated trading has overfitting risks.
Optimization Directions
- Optimize MA parameters to better determine overall trends.
- Incorporate volume indicators to avoid reversal signals in volume exhaustion scenarios.
- Add machine learning models to enable dynamic parameter optimization.
Summary
The overall logic of this strategy is clear and has some practical value. However, trading risks should still be controlled to prevent large losses in certain market conditions. Next steps include optimizing multiple dimensions such as the overall framework, indicator parameters, and risk control to make the strategy parameters and trading signals more reliable.
Source
Pine
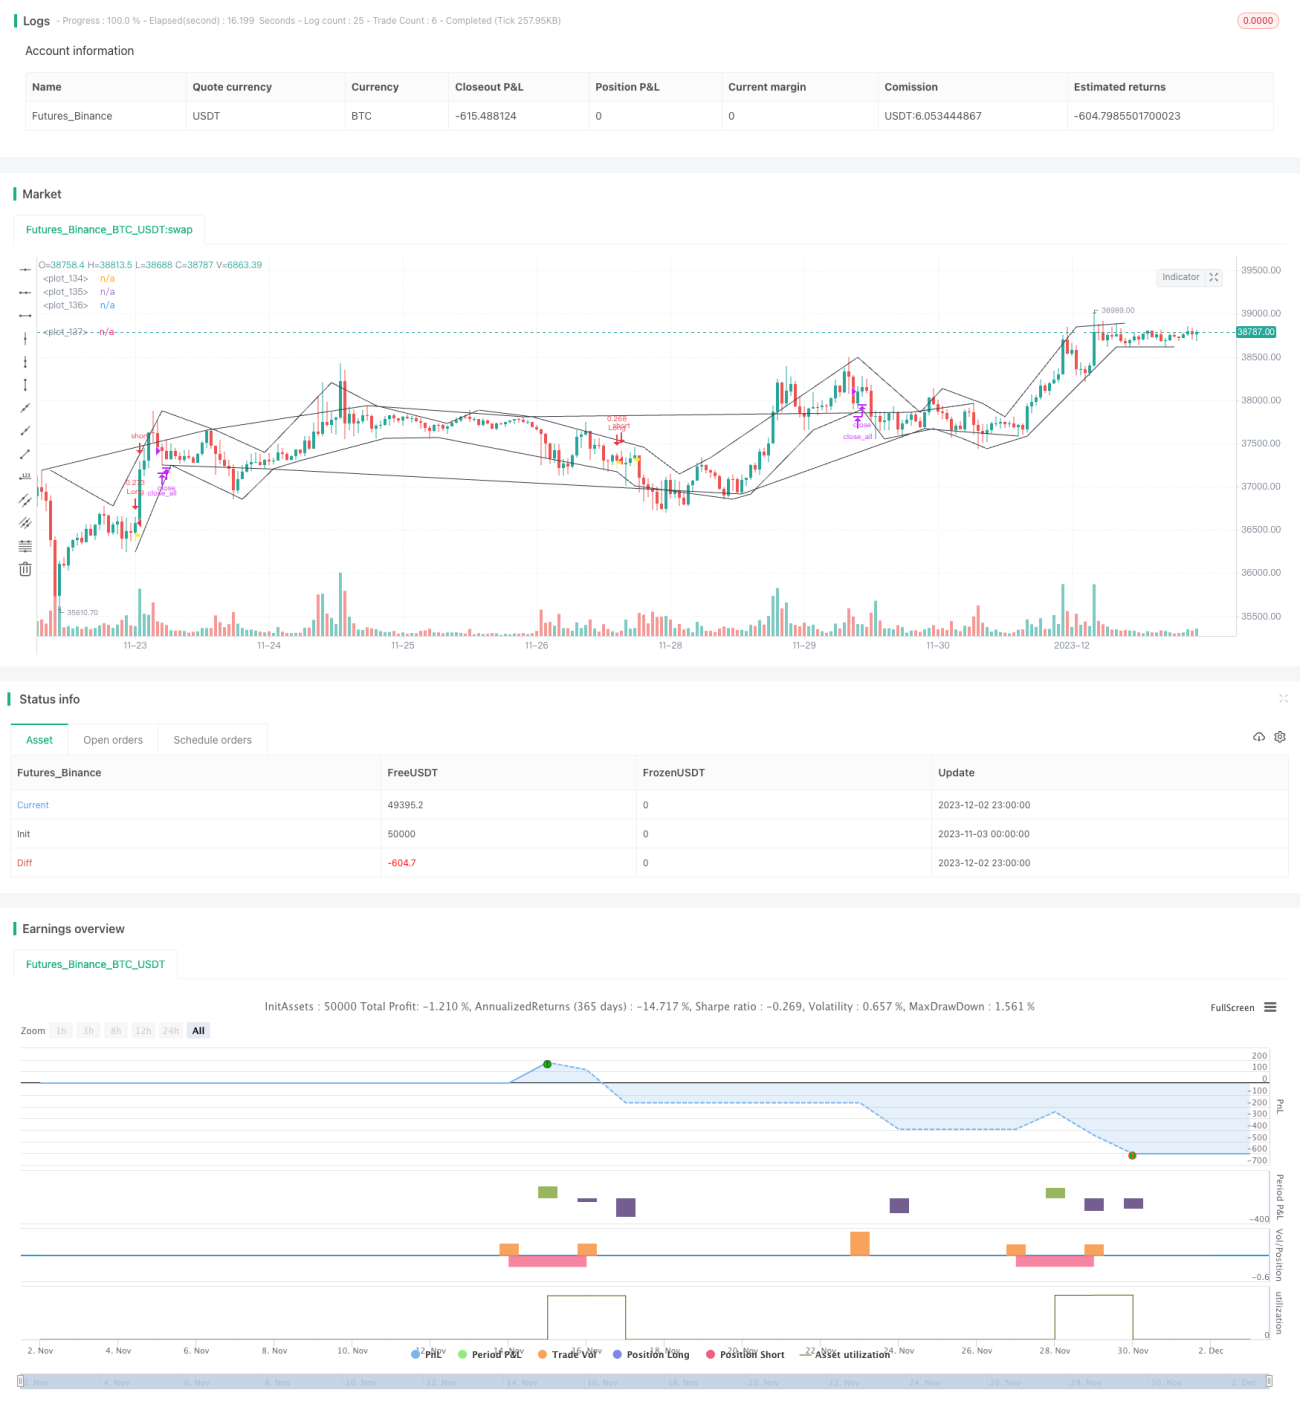
/*backtest
start: 2023-11-03 00:00:00
end: 2023-12-03 00:00:00
period: 1h
basePeriod: 15m
exchanges: [{"eid":"Futures_Binance","currency":"BTC_USDT"}]
*/

// @version = 4
// This source code is subject to the terms of the Mozilla Public License 2.0 at https://mozilla.org/MPL/2.0/
// © TradingGroundhog
Strategy parameters
Related strategies
Comment
All comments (0)
No data
- 1