Double Moving Average Oscillation Trading Strategy

Overview
The Double Moving Average Oscillation Trading Strategy generates trading signals by combining the 2/20 exponential moving average and the Adaptive Price Zone oscillation indicator to profit in oscillating markets. This strategy is mainly suitable for markets with obvious oscillation characteristics, such as stock index, forex, commodity and digital currency.
Strategy Principle
The Double Moving Average Oscillation Trading Strategy consists of two parts:
-
2/20 Exponential Moving Average. This indicator generates a buy signal when the price breaks through the 20-day line and does not break through the 2-day line on the rise; it generates a sell signal when the price breaks through the 2-day line and does not exceed the 20-day line on the decline.
-
Adaptive Price Zone Oscillation Indicator. This indicator constructs price bands based on the volatility range of prices and judges market turning points by prices breaking through upper and lower price bands to generate buy and sell signals.
The Double Moving Average Oscillation Trading Strategy generates actual trading signals only when the 2/20 exponential moving average and the Adaptive Price Zone oscillation indicator issue signals at the same time to implement strategy trading. This can effectively filter out some invalid signals and improve signal quality.
Advantage Analysis
The Double Moving Average Oscillation Trading Strategy combines the advantages of moving average indicators and volatility indicators, with the following characteristics:
-
Reliable trading signals. Double indicator verification improves signal quality and filters out invalid signals effectively.
-
Adapt to oscillating markets. The combined use of moving average and price band indicators can accurately determine turning points in oscillating markets.
-
Moderate operation frequency. Compared with the dual exponential moving average strategy, it can reduce the occurrence of invalid transactions.
-
Easy to implement automatic trading. The signal rules are clear and the parameters are simple to set, which is easy to program to achieve automatic trading.
Risk Analysis
The Double Moving Average Oscillation Trading Strategy also has the following risks:
-
Signal delay may be large. Combining double indicators to filter signals may miss opportunities for rapid price reversals.
-
Poor performance when oscillation weakens. The strategy relies mainly on oscillating markets, and trading signals and profit margins will decrease as volatility weakens.
-
Significant impact of parameter optimization. Indicator parameter settings can have a greater impact on trading outcomes and need to be systematically optimized for optimum parameters.
In response to the above risks, methods such as dynamically adjusting parameters can be adopted to adapt to market environmental changes, while setting stop loss strategies to control downside risk.
Optimization Directions
The Double Moving Average Oscillation Trading Strategy can be optimized in the following aspects:
-
Test more combinations of moving averages and price bands. Systematically test moving averages and price bands of different lengths to find the optimal parameter combination.
-
Add volume indicator to filter signals. Combining abnormal trading volume signals to filter price signals of moving averages can further improve signal quality.
-
Set dynamic stop loss mechanism. When market volatility weakens, appropriately tighten stop loss points to reduce single loss.
-
Combine deep learning models. Use LSTM and other deep learning models to verify trading signals to make strategies more intelligent.
Summary
The Double Moving Average Oscillation Trading Strategy generates high-quality oscillation trading signals by combining the 2/20 exponential moving average and the Adaptive Price Zone oscillation indicator, which can adapt to volatile markets such as stock index, forex, commodity with large fluctuations and conduct frequent trading arbitrage within the oscillation range. The strategy has advantages such as high signal quality and easy automation. At the same time, risks such as delayed identification of turning points and dynamic adjustment of parameters also need to be controlled, and there is still great room for optimization on this basis.
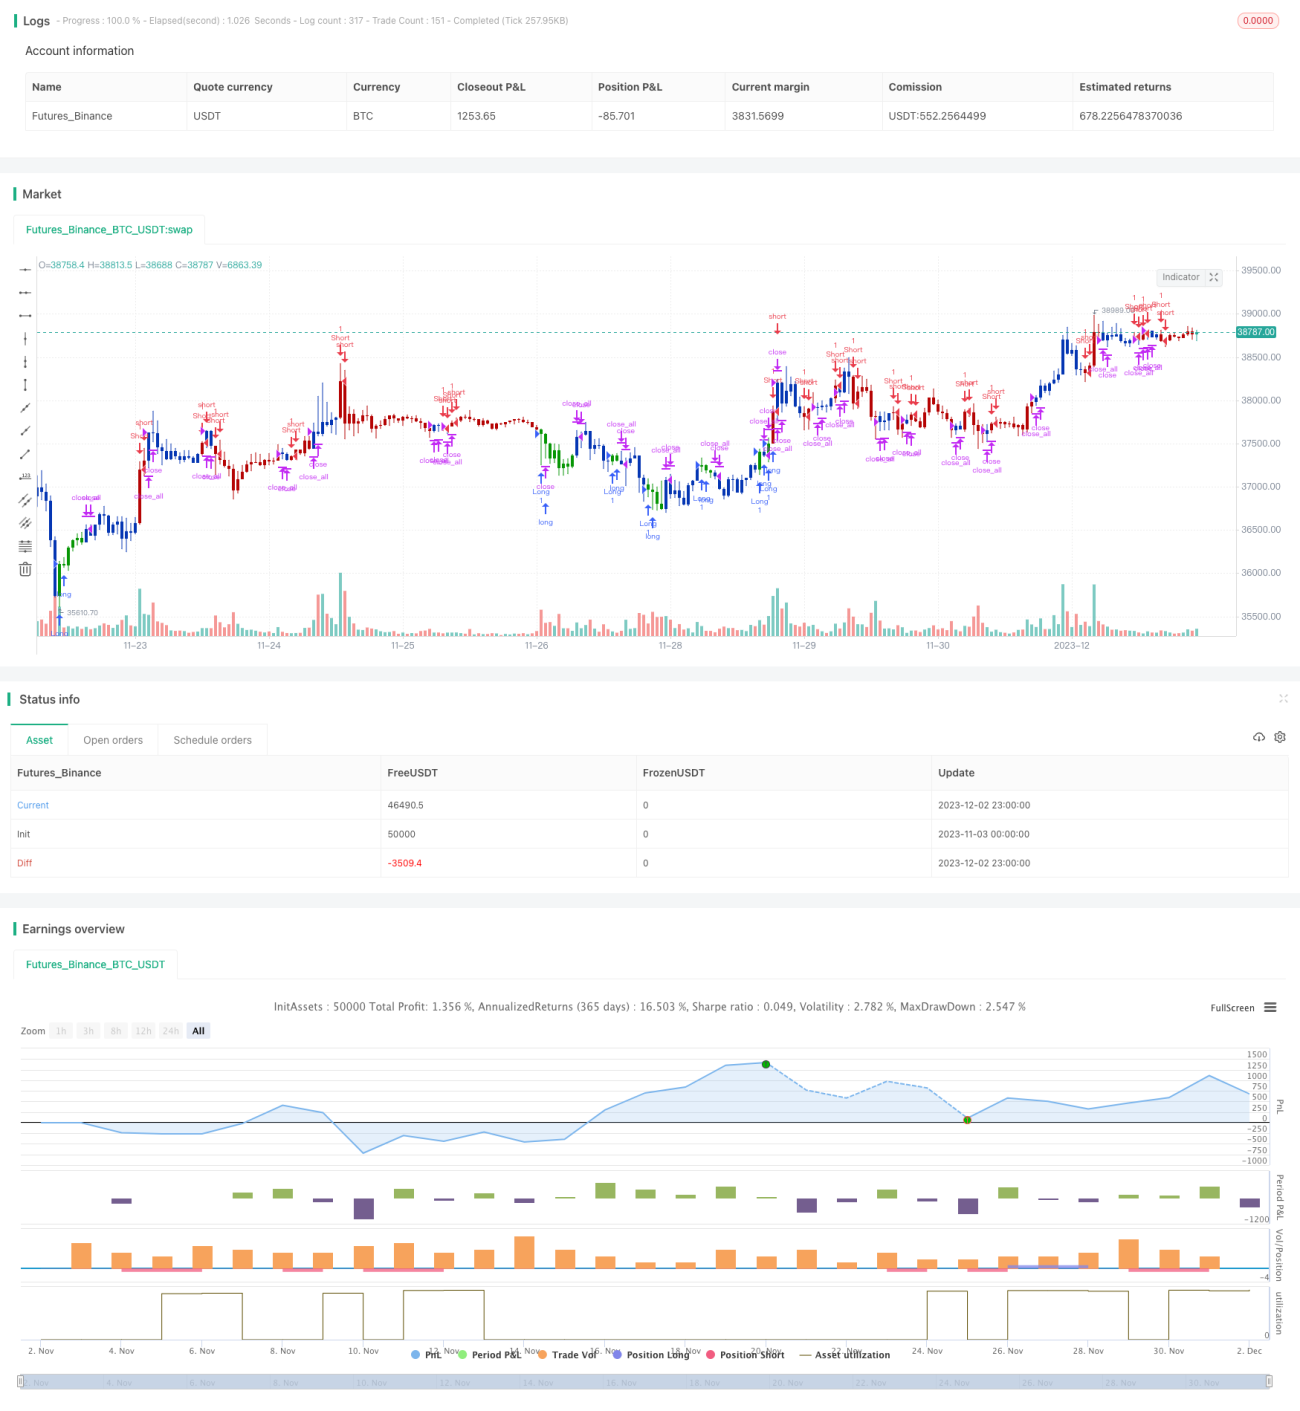
/*backtest
start: 2023-11-03 00:00:00
end: 2023-12-03 00:00:00
period: 1h
basePeriod: 15m
exchanges: [{"eid":"Futures_Binance","currency":"BTC_USDT"}]
*/

//@version=5
////////////////////////////////////////////////////////////
//  Copyright by HPotter v1.0 02/03/2022
// This is combo strategies for get a cumulative signal. - 1