Dynamic Moving Average Tracking Strategy

Overview
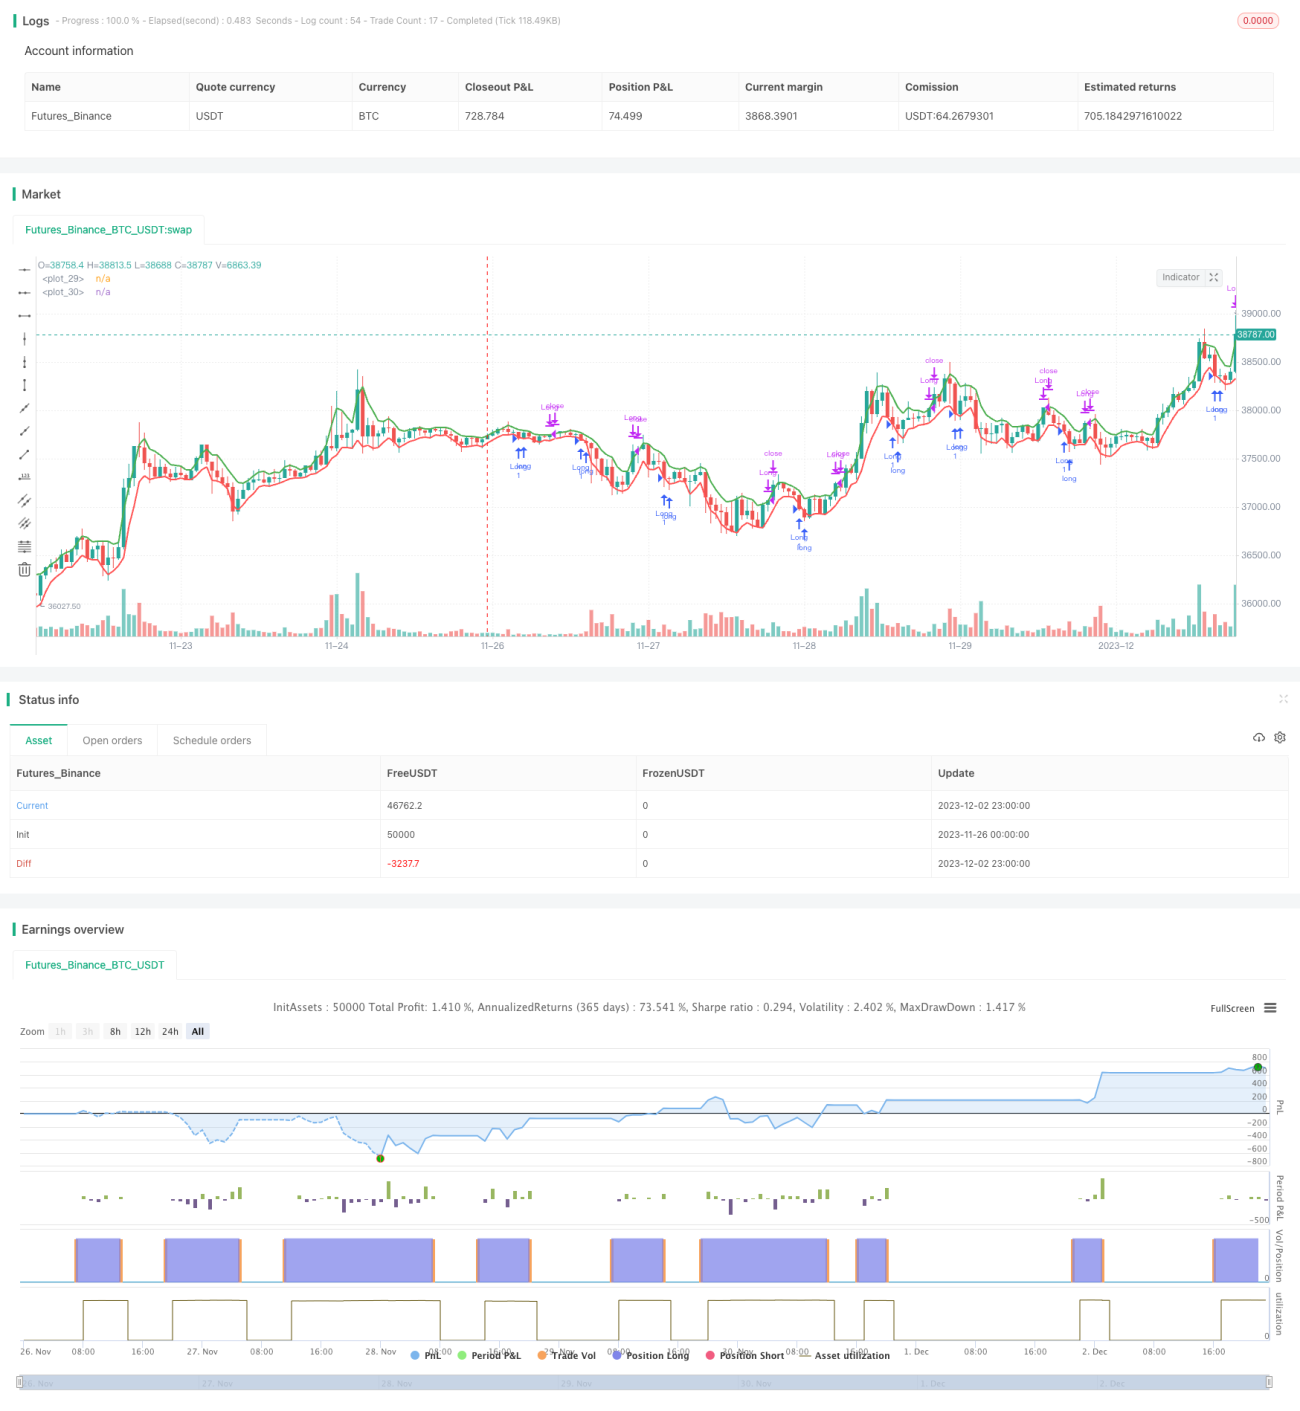
This strategy uses the approach explained by Larry Williams in his book "Long-Term Secrets to Short-Term Trading", which utilizes two 3-period moving averages, one representing the Highs and the other the Lows. When the price falls below the 3-period Lows EMA we have a long signal. The trade is closed when the price closes above the 3-period Highs EMA.
Strategy Logic
The core logic of this strategy is to compute 3-period moving averages of the high and low prices. Specifically, it uses the ta.ema function to calculate exponential moving averages of the high and low prices over the most recent 3 bars to generate dynamic support and resistance levels. When the price breaks below the lows EMA, it indicates a downtrend, so we can go long. When the price rises back above the highs EMA, it suggests the uptrend has ended and we should close our position. In this way, the strategy can dynamically track price changes and achieve buying low and selling high.
Advantage Analysis
The biggest advantage of this strategy is its simplicity and dynamism. Compared to taking fixed period highs/lows moving averages, this strategy uses continuous short-term moving averages, which can more sensitively and timely capture price changes. This allows it to quickly identify trading opportunities to enter and exit the market. Also, low computation load is another advantage for reducing trading latency.
Risks and Solutions
The main risk of this strategy is that it reacts slower to sudden events like significant news. Because its moving average period is very short, it takes some time to adjust the moving average levels when there is a sharp price spike. This may lead to losses or missing opportunities. Also, oversensitivity may cause wrong trades. To mitigate these risks, we can appropriately increase the moving average period, or add filters to avoid false signals.
Optimization Directions
There is still large room for optimizing this strategy. Firstly, oscillators can be incorporated to filter the signals. Secondly, stop loss logic could be added to control risks. Also, we can dynamically tune the moving average parameters based on market states, using longer periods in trending and shorter periods in ranging markets. Additionally, multi-timeframe analysis, pattern recognition with machine learning etc. can help improve strategy performance.
Conclusion
In summary, this is a very simple and practical strategy, identifying trends using short-term high/low moving averages. Its advantages are strong dynamism, low computation, and high responsiveness, suitable for active trading. But it also has deficiencies in responding to extreme events and higher false signals risk. There are directions to address these issues through parameter tuning, adding filters, and pattern recognition techniques to further lift the strategy efficacy.
- 1