Adaptive Price Channel Strategy

Author: ChaoZhang, Date: 2023-12-04 16:33:45
Tags:

img

Overview

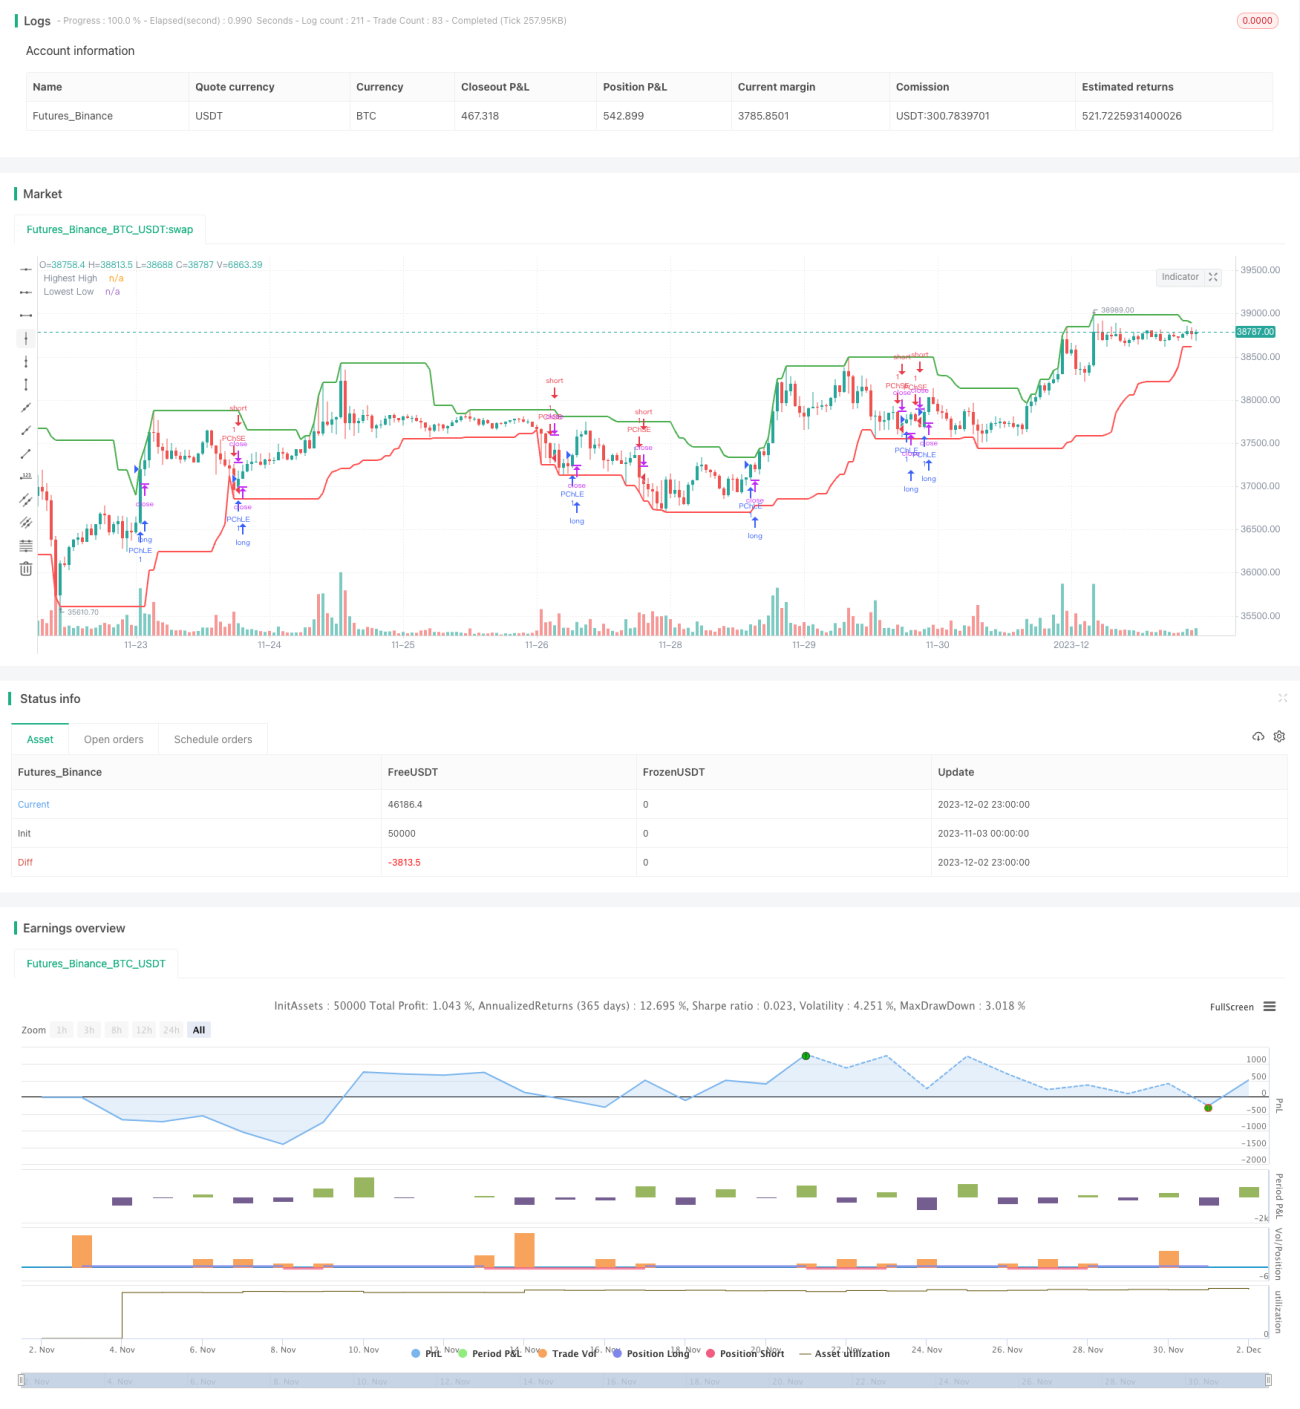
This strategy is an adaptive price channel strategy based on the Average True Range (ATR) indicator and Average Directional Index (ADX). It aims to identify sideways markets and trends in price movements and make trades accordingly.

Strategy Logic

  1. Calculate the highest high (HH) and lowest low (LL) over a given length. Also calculate ATR over the same length.

  2. Calculate +DI and -DI based on upward and downward price moves. Then calculate ADX.

  3. If ADX < 25, the market is considered sideways. If close > upper channel (HH - ATR multiplier * ATR), go long. If close < lower channel (LL + ATR multiplier * ATR), go short.

  4. If ADX >= 25 and +DI > -DI, market is bullish. If close > upper channel, go long.

  5. If ADX >= 25 and +DI < -DI, market is bearish. If close < lower channel, go short.

  6. Exit position after exit_length bars since entry.

Advantage Analysis

  1. The strategy adapts automatically based on market conditions, using channel strategy in sideways market and trend following in trending market.

  2. Using ATR and ADX ensures adaptiveness. ATR adjusts channel width, ADX determines trend.

  3. Forced exit adds stability.

Risk Analysis

  1. ADX can generate false signals frequently.

  2. Poor ATR and ADX parameters lead to bad performance.

  3. Unable to effectively guard against black swan events.

Optimization Directions

  1. Optimize parameters for ATR and ADX to improve adaptability.

  2. Add stop loss to limit losses.

  3. Add filters to avoid false signals.

Conclusion

The strategy combines indicators and mechanisms to adapt across market conditions. But misjudgements can happen due to indicator limitations. Future optimizations on parameters and risk control.


/*backtest
start: 2023-11-03 00:00:00
end: 2023-12-03 00:00:00
period: 1h
basePeriod: 15m
exchanges: [{"eid":"Futures_Binance","currency":"BTC_USDT"}]
*/

//@version=5
strategy("Adaptive Price Channel Strategy", overlay=true)

length = input(20, title="Length")
exit_length = input(10, title="Exit After X Periods")
atr_multiplier = input(3.2, title="ATR Multiplier")

startDate = input(defval = timestamp("2019-01-15T08:15:15+00:00"), title = "Start Date")
endDate = input(defval = timestamp("2033-04-01T08:15:00+00:00"), title = "End Date")

hh = ta.highest(high, length)
ll = ta.lowest(low, length)
atr = ta.atr(length)

// calculate +DI and -DI
upMove = high - high[1]
downMove = low[1] - low
plusDM = na(upMove[1]) ? na : (upMove > downMove and upMove > 0 ? upMove : 0)
minusDM = na(downMove[1]) ? na : (downMove > upMove and downMove > 0 ? downMove : 0)
plusDI = ta.rma(plusDM, length) / atr * 100
minusDI = ta.rma(minusDM, length) / atr * 100

// calculate ADX
dx = math.abs(plusDI - minusDI) / (plusDI + minusDI) * 100
adx = ta.rma(dx, length)

var int barSinceEntry = na

if (not na(close[length]) )
    if (adx < 25) // Sideways market
        if (close > hh - atr_multiplier * atr)
            strategy.entry("PChLE", strategy.long, comment="PChLE")
            barSinceEntry := 0
        else if (close < ll + atr_multiplier * atr)
            strategy.entry("PChSE", strategy.short, comment="PChSE")
            barSinceEntry := 0
    else if (adx >= 25 and plusDI > minusDI) // Bullish market
        if (close > hh - atr_multiplier * atr)
            strategy.entry("PChLE", strategy.long, comment="PChLE")
            barSinceEntry := 0
    else if (adx >= 25 and plusDI < minusDI) // Bearish market
        if (close < ll + atr_multiplier * atr)
            strategy.entry("PChSE", strategy.short, comment="PChSE")
            barSinceEntry := 0

if (na(barSinceEntry))
    barSinceEntry := barSinceEntry[1] + 1
else if (barSinceEntry >= exit_length)
    strategy.close("PChLE")
    strategy.close("PChSE")
    barSinceEntry := na

plot(hh, title="Highest High", color=color.green, linewidth=2)
plot(ll, title="Lowest Low", color=color.red, linewidth=2)


More