PercentR Reversa Channe Strategy

Strategy Overview
This is a reversal trading strategy based on the Laruent Channel indicator. It calculates the highest and lowest prices over a certain period of time in the past to determine if the current price is in the overbought or oversold area. If the price is close to the upper or lower rail, it will open a position in the opposite direction and wait for the price to return to the middle line.
Strategy Principle
The strategy is mainly based on two indicators: PercentR indicator (%R) and Laruent Channel rails.
The PercentR indicator shows the distance between the current closing price and the highest and lowest prices over the most recent period. The value range is from 0 to -100. A value close to 0 means the current closing price is near the highest point recently. And a value close to -100 means the current closing price is near the lowest price recently.
The Laruent Channel consists of upper rail, middle line and lower rail. The upper rail equals the highest price over the most recent period. The lower rail equals the lowest price over that period. The middle line is the mean of the upper and lower rails. If the price exceeds the upper rail, it is considered overbought. If the price is below the lower rail, it is considered oversold.
The strategy first calculates the PercentR indicator and Laruent Channel rails, then uses the two indicators to determine if the current status is overbought or oversold:
- When PercentR is below -87, the status is considered oversold.
- When PercentR is above -20, the status is considered overbought.
If the current status is neither overbought nor oversold, it will long at market open. And close the position before market close on the same day.
By capturing the price reversal, it can make profits in short term.
Advantages
- The strategy is simple and clear, easy to understand and implement.
- Using PercentR indicator to judge overbought/oversold status is reliable.
- Making orders at market open and closing positions before market close avoids overnight risk.
- As a reversal trading strategy, it is suitable for short term profit making.
Risks
- Failed reversal, cannot exit with profit.
- Improper parameter settings, cannot judge overbought/oversold status correctly.
- Too short intraday trading time, fewer trading signals.
Risks can be reduced by optimizing parameters, adjusting order placement time, or combining with other indicators.
Optimization
- A stop loss mechanism can be introduced to set a stop loss line to avoid loss expansion.
- The parameters of PercentR can be optimized to make overbought/oversold judgment more accurate.
- The strategy can be used on multiple timeframes simultaneously to implement multi-timeframe trading.
- It can be combined with other indicators like KDJ, MACD to make trading signals more reliable.
Summary
In general, this strategy is quite simple and practical. It is designed based on the reversal trading idea and suitable for short term frequent trading. There is large room for optimization. More technical indicators can be introduced for combination. And automatic stop loss mechanisms can also be established to control risks.
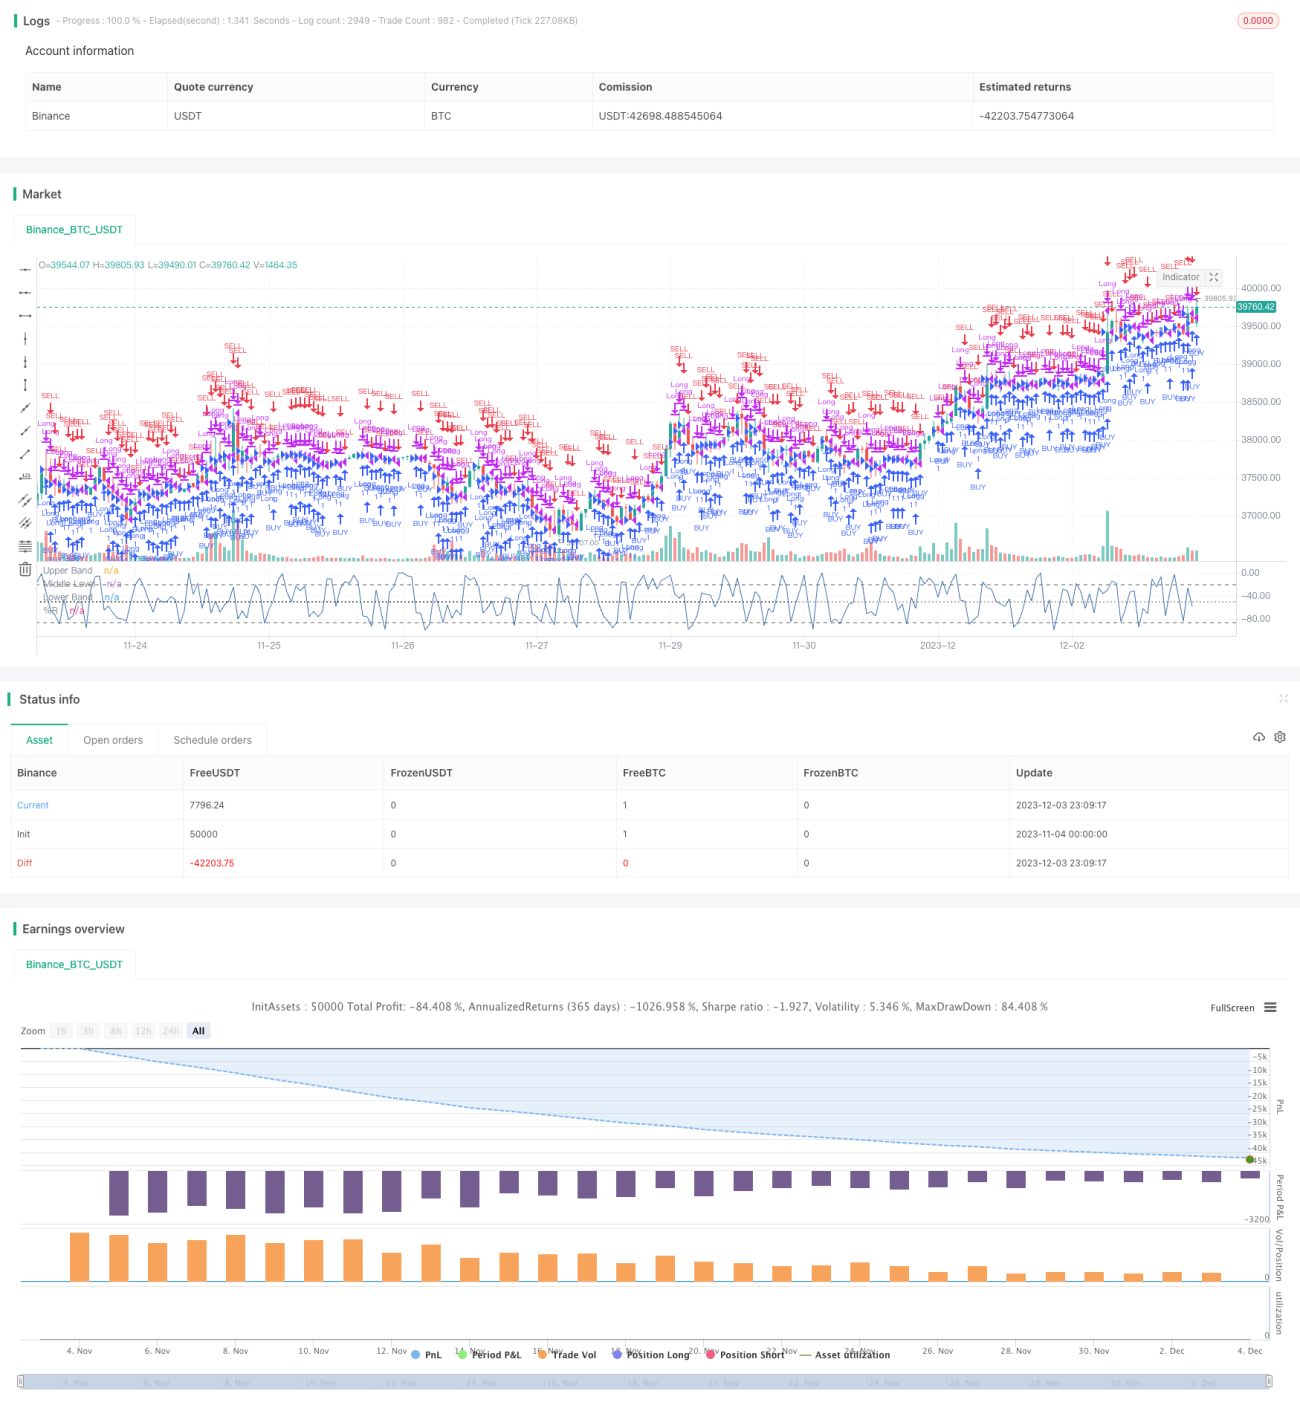
/*backtest
start: 2023-11-04 00:00:00
end: 2023-12-04 00:00:00
period: 1h
basePeriod: 15m
exchanges: [{"eid":"Binance","currency":"BTC_USDT"}]
*/

//@version=4
// This source code is subject to the terms of the Mozilla Public License 2.0 at https://mozilla.org/MPL/2.0/
// © zweiprozent original strategy by larry williams
- 1