TTM Falcon Oscillator Reversal Strategy Based on Price Reversion

Overview
The strategy is named "TTM Falcon Oscillator Reversal Strategy Based on Price Reversion". It is an oscillator indicator that searches for trading signals based on price reversal signals.
The main idea of the strategy is to judge trend reversals by using price patterns. When the price forms three new highs or lows K-line bars, it is judged as a price reversal signal to take corresponding long or short positions.
Strategy Logic
The strategy judges price reversals by observing the closing price changes of K-line bars. The specific logic is:
-
When the closing price of the first K-line bar is lower than the second one, the signal is recorded as 1; when higher, the signal is recorded as 0.
-
If the previous signal was 1 (representing a price decline), and the closing price of either the second or the third K-line bar is lower than the first one, it is judged as a price reversal signal and a sell signal is issued.
-
If the previous signal was 0 (representing a price rise), and the closing price of either the second or the third K-line bar is higher than the first one, it is judged as a price reversal signal and a buy signal is issued.
Through this method, the strategy can quickly judge price reversals and enter positions in time around reversal points.
Advantage Analysis
The main advantages of this strategy are:
-
Fast reaction. By only comparing the size relationship among three K-line bars to judge price reversals, it can quickly determine market reversal points and enter positions in time.
-
Reduced trading frequency. Compared with other oscillator strategies, this strategy only issues signals when prices clearly reverse, which can effectively reduce unnecessary trades.
-
Large optimization space for parameters. The strategy has great potential for optimization and the K-line cycle parameters can be adjusted to adapt to different market environments.
-
Quantifiable backtesting. The strategy can be directly implemented for automated backtesting on quantitative platforms, greatly improving test efficiency.
-
Simple and easy to understand logic. novice traders can also easily understand and grasp the core logic of the strategy.
Risk Analysis
The strategy also has certain risks, mainly embodied in:
-
Large price fluctuation range. When the price fluctuates too violently, the reversal signals may be inaccurate, prone to chasing highs and selling lows.
-
Difficult parameter optimization. The choice of K-line cycle parameters has a great influence on the strategy's performance, requiring a lot of optimization to find the optimal parameter combination.
-
Excessively frequent trading. In some market environments, reversal signals may be too frequent, resulting in too many trades.
-
Unpredictable reversal duration. The strategy cannot determine how long the new trend after price reversal will last, with the risk of inability to hold the trend.
The corresponding solutions are: appropriately adjust parameters to reduce price fluctuation ranges, fully optimize and test under various market environments, and set stop loss to control single loss.
Optimization Directions
The main directions for optimizing this strategy include:
-
K-line cycle optimization. Appropriately adjust the time cycle parameters of K-line to find the optimal parameter combination.
-
Add filtering conditions. Add other auxiliary conditions before issuing signals to avoid erroneous signals.
-
Add stop loss mechanism. Set reasonable stop loss points to control single losses.
-
Combine other indicators. Integrate signals of moving average, volatility and other indicators to improve decision accuracy.
-
Adaptive parameter optimization. Allow parameters to dynamically adjust based on market environment changes to make the strategy more robust.
Through these optimizations, the stability, win rate and profitability of the strategy can be greatly improved.
Conclusion
In summary, the idea of this strategy to determine reversal points by price patterns is very simple and straightforward, with clear and easy to understand logic, and relatively large space for parameter optimization that can be adjusted according to personal preferences. But there are also certain risks that the signals may be too frequent and the holding period control improper. Through rigorous backtesting and robust parameter optimization, this strategy can become one of the efficient and profitable oscillator trading strategies.
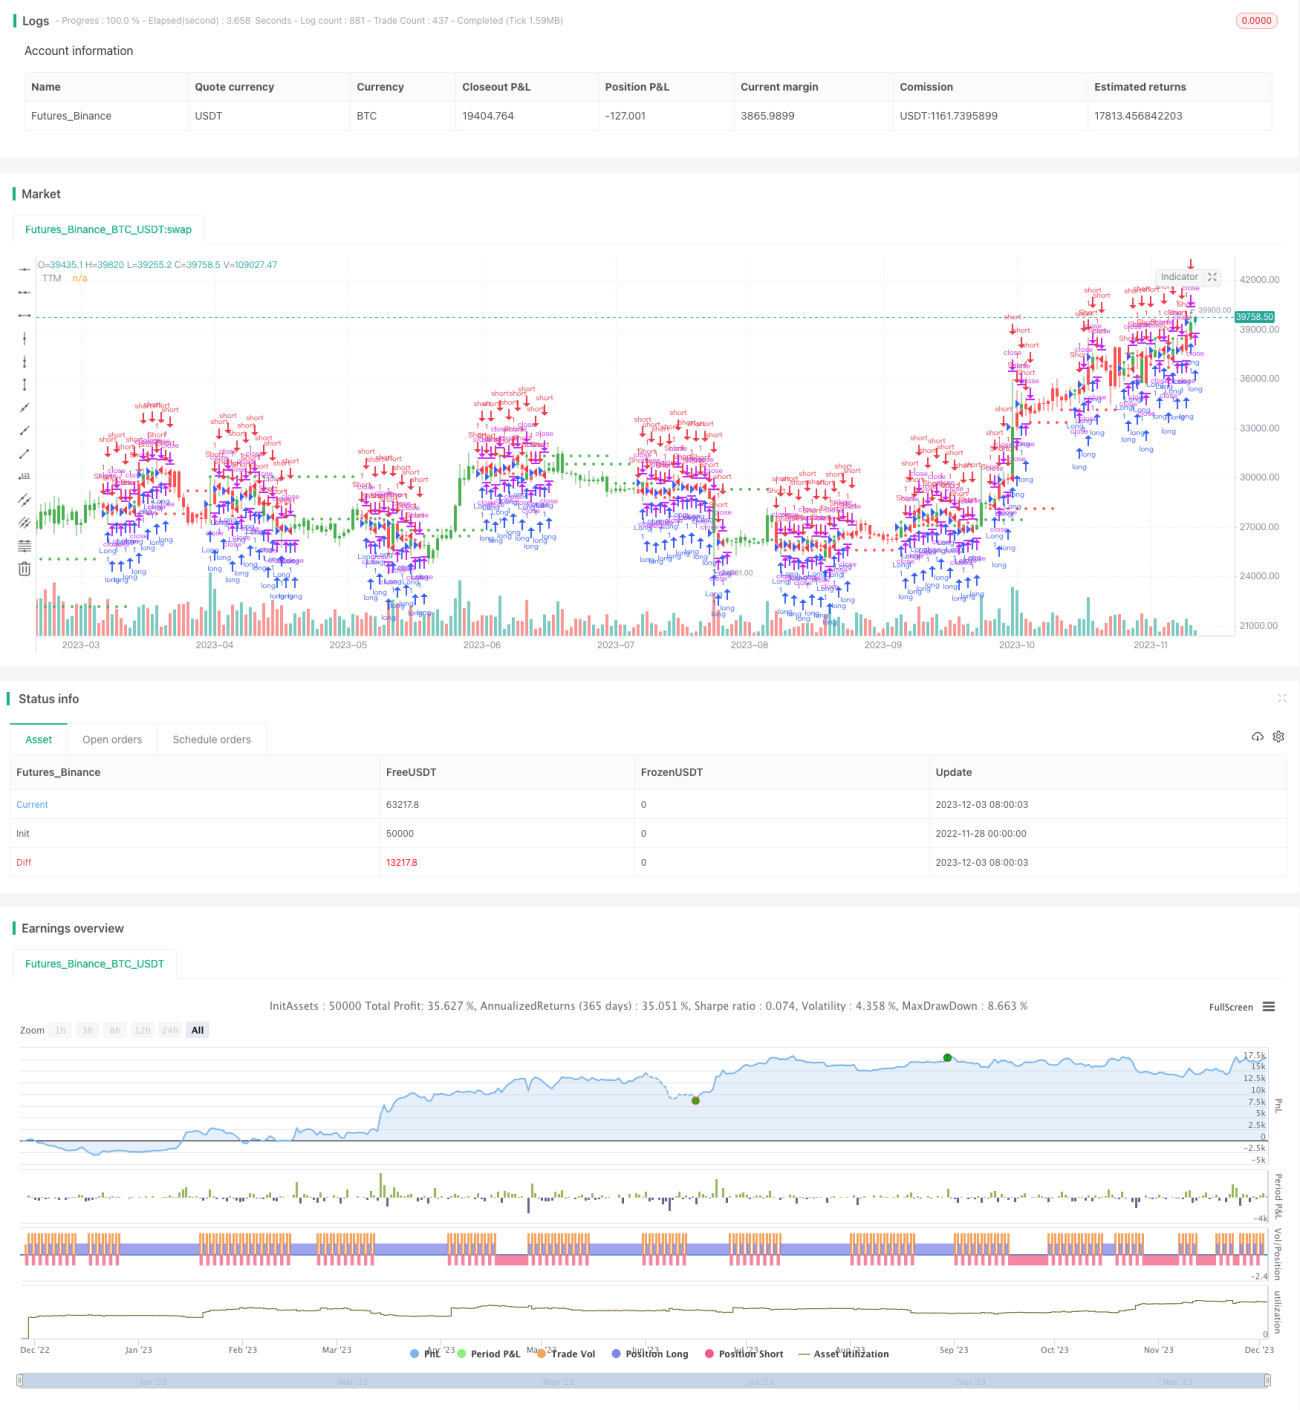
/*backtest
start: 2022-11-28 00:00:00
end: 2023-12-04 00:00:00
period: 1d
basePeriod: 1h
exchanges: [{"eid":"Futures_Binance","currency":"BTC_USDT"}]
*/

//@version=2
////////////////////////////////////////////////////////////
//  Copyright by HPotter v2.0 10/01/2018
// TTM scalper indicator of John Carter’s Scalper Buys and Sells. The methodology - 1