Weighted Quantitative Moving Average Crossover Trading Strategy

Author: ChaoZhang, Date: 2023-12-06 12:05:01
Tags:

img

Overview

This strategy is named Weighted Quantitative Moving Average Crossover Strategy. The basic idea is to design fast and slow lines based on price, trading volume and other indicators, and generate buy and sell signals when golden cross and dead cross occur between them.

Strategy Logic

The core indicator of this strategy is Quantitative Moving Average (QMA). QMA measures the trend direction by calculating the weighted average price over a period of time. Different from regular moving average, the weights (weight = price * trading volume) of prices in QMA will decay over time. Thus, the latest prices have bigger weights which can respond to the market change more rapidly.

Specifically, this strategy builds fast QMA line with 25 days and slow QMA line with 29 days. It will generate buy signal when fast line crosses above slow line, and sell signal when fast line crosses below slow line.

Advantage Analysis

Compared with regular moving average, this strategy has the following advantages:

  1. Respond to the market more promptly, which enables it to capture short-term opportunities.
  2. Combine multiple dimensions including price and trading volume, which makes it more stable.
  3. Flexible parameter settings to adapt to different market environments.

Risk Analysis

This strategy also has some risks:

  1. High trading frequency of short-term operations, which may lead to increased transaction costs and slippages.
  2. Overfitting due to excessive parameter optimization.
  3. Indicator effect may be compromised when the trading volume is insufficient.

The above risks could be mitigated by appropriately adjusting the frequency, strictly walk forward analysis, and incorporating other indicators.

Improvement Directions

There is still room for further optimization of this strategy:

  1. Dynamically adjust the parameters of QMA to make it self-adaptive to market volatility.
  2. Filter trading opportunities with indicators like volatility and trading volume.
  3. Add stop loss strategies to control single loss.

Conclusion

In general, this is a stable short-term trading strategy. Compared with single price average, its indicator can better reflect the supply-demand relationship in the market. With proper parameter tuning and risk management, this strategy can operate steadily for the long run and gain sound profit.
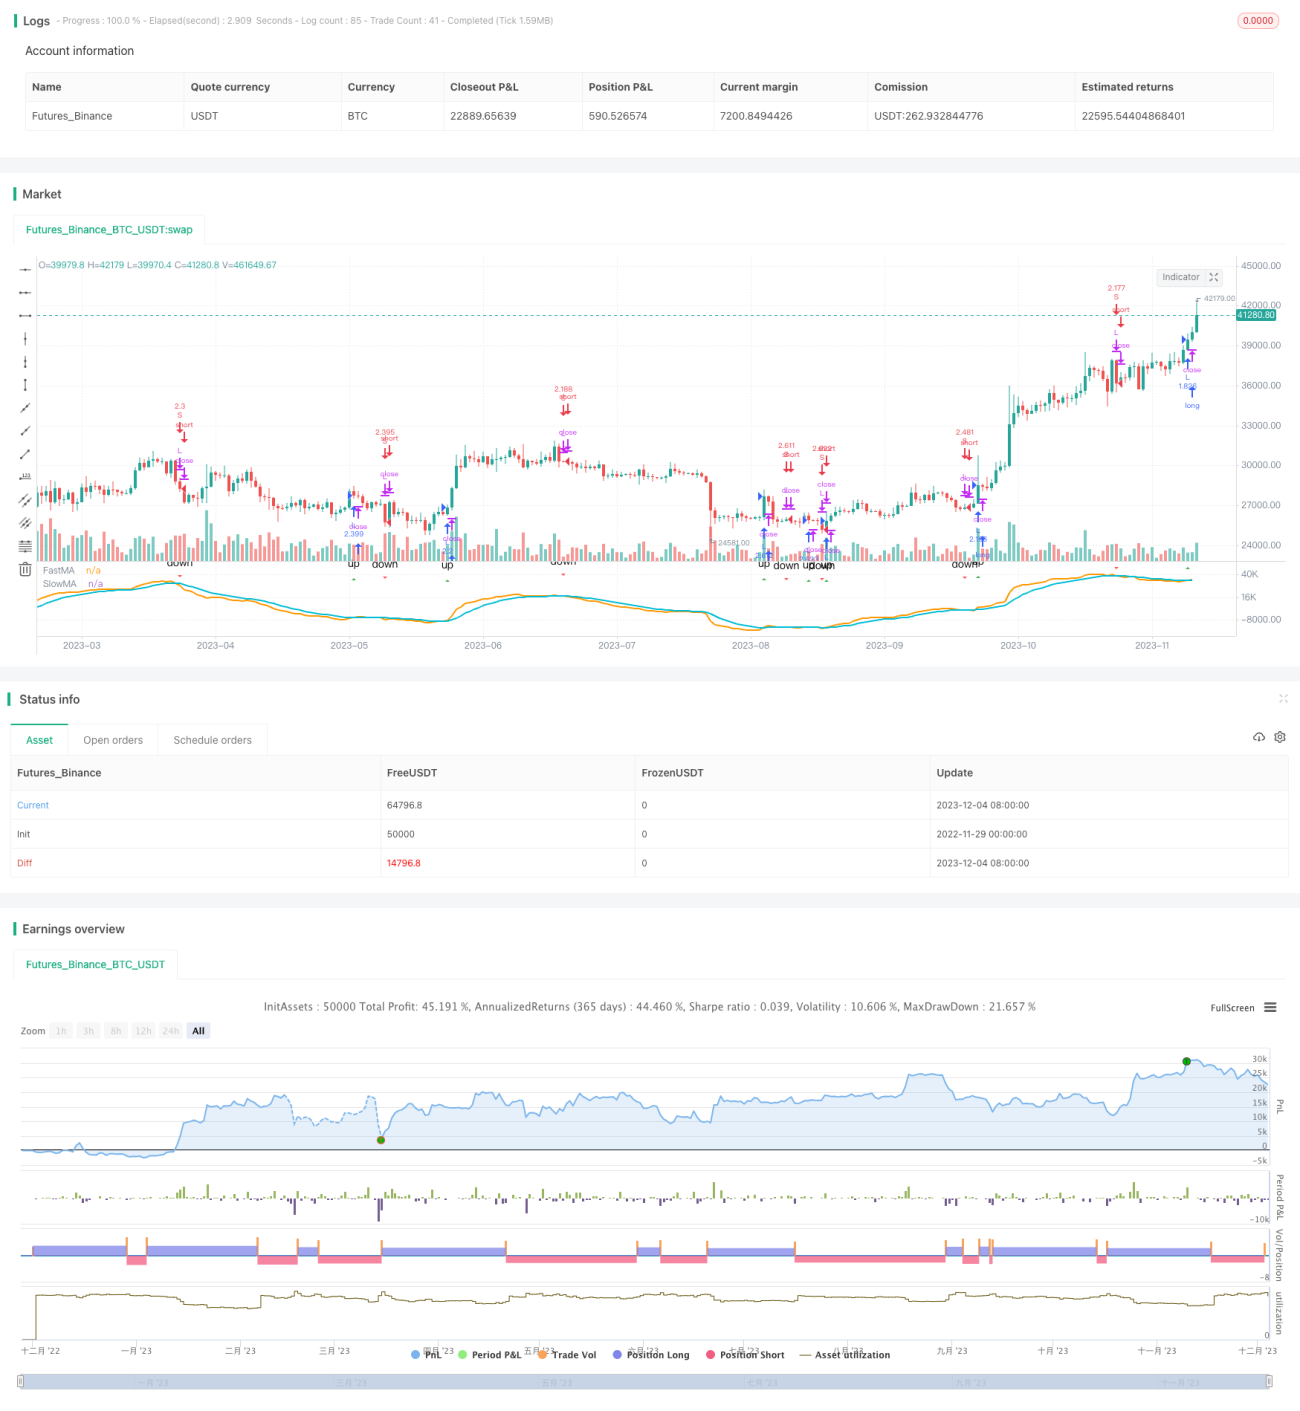

/*backtest
start: 2022-11-29 00:00:00
end: 2023-12-05 00:00:00
period: 1d
basePeriod: 1h
exchanges: [{"eid":"Futures_Binance","currency":"BTC_USDT"}]
*/

//@version=3
strategy("Brad VWMACD Strategy 2233", overlay=false, max_bars_back=500,default_qty_type=strategy.percent_of_equity,commission_type=strategy.commission.percent, commission_value=0.18, default_qty_value=100)

// === INPUT BACKTEST RANGE === 
FromMonth = input(defval = 9, title = "From Month", minval = 1, maxval = 12)
FromDay   = input(defval = 1, title = "From Day", minval = 1, maxval = 31)
FromYear  = input(defval = 2018, title = "From Year", minval = 2017)
ToMonth   = input(defval = 1, title = "To Month", minval = 1, maxval = 12)
ToDay     = input(defval = 1, title = "To Day", minval = 1, maxval = 31)
ToYear    = input(defval = 9999, title = "To Year", minval = 2017)

// === FUNCTION EXAMPLE ===
start     = timestamp(FromYear, FromMonth, FromDay, 00, 00)  // backtest start window
finish    = timestamp(ToYear, ToMonth, ToDay, 23, 59)        // backtest finish window
window()  => time >= start and time <= finish ? true : false // create function "within window of time"

// === INPUT SMA === 
//fastMA    = input(defval = 16, type = integer, title = "FastMA", minval = 1 )
//slowMA    = input(defval = 23, type = integer, title = "SlowMA", minval = 1)

fastMA    = input(defval = 25, title = "FastMA", minval = 1 )
slowMA    = input(defval = 29,  title = "SlowMA", minval = 1)

Long_period = slowMA
Short_period = fastMA
Smoothing_period = input(9, minval=1)
xLongMAVolPrice = ema(volume * close, Long_period) 
xLongMAVol = ema(volume, Long_period) 
xResLong = (xLongMAVolPrice * Long_period) / (xLongMAVol * Long_period)
xShortMAVolPrice = ema(volume * close, Short_period) 
xShortMAVol = ema(volume, Short_period) 
xResShort = (xShortMAVolPrice * Short_period) / (xShortMAVol * Short_period)
xVMACD = xResShort - xResLong
xVMACDSignal = ema(xVMACD, Smoothing_period)
nRes = xVMACD - xVMACDSignal
//plot(nRes*20+slowMA, color=blue, style = line )
//plot(3000, color=red, style = line )


// === SERIES SETUP ===

buy  = crossover( xVMACD,xVMACDSignal)     // buy when fastMA crosses over slowMA
sell = crossunder( xVMACD,xVMACDSignal)  // sell when fastMA crosses under slowMA


// === SERIES SETUP === 

//buy  = crossover(vwma(close, fastMA),7+vwma(close, slowMA))     // buy when fastMA crosses over slowMA
//sell = crossunder(vwma(close, fastMA),vwma(close, slowMA)-7)    // sell when fastMA crosses under slowMA

// === EXECUTION ===
strategy.entry("L", strategy.long, when = window() and buy)  // buy long when "within window of time" AND crossover
strategy.close("L", when = window() and sell)                // sell long when "within window of time" AND crossunder         

// === EXECUTION ===
strategy.entry("S", strategy.short, when = window() and sell)  // buy long when "within window of time" AND crossover
strategy.close("S", when = window() and buy)                // sell long when "within window of time" AND crossunder         

plotshape(window() and buy, style=shape.triangleup, color=green, text="up")
plotshape(window() and sell, style=shape.triangledown, color=red, text="down")
plot(xVMACD*100, title = 'FastMA', color = orange, linewidth = 2, style = line)  // plot FastMA
plot(xVMACDSignal*100, title = 'SlowMA', color = aqua, linewidth = 2, style = line)    // plot SlowMA


More