Dual Moving Average ADX Timing Strategy

Overview
The Dual Moving Average ADX Timing strategy identifies trends by combining 2/20 moving averages and the ADXR indicator to generate trading signals at the beginning of trends. It first uses the 2/20 exponential moving averages to determine the price trend direction, then further confirms the trend signal in combination with the ADXR indicator, thus producing more reliable trading signals.
Strategy Logic
The core logic of the Dual Moving Average ADX Timing strategy is based on the following main components:
-
2/20 Exponential Moving Average (EMA)
- Uses 2 EMAs with different parameters of 2 and 20 days.
- A upward cross of price over 2-day EMA is considered a bullish signal.
- A downward cross of price below 20-day EMA is considered a bearish signal.
-
ADXR Indicator
- ADXR is a variant of the ADX indicator.
- It calculates a simple moving average of ADX to smooth out fluctuations.
- ADXR below a threshold implies weaker trend.
- ADXR above a threshold implies stronger trend.
-
Trading signals
- A bullish signal is generated when 2-day EMA Golden Cross AND ADXR is higher than threshold.
- A bearish signal is generated when 20-day EMA Dead Cross AND ADXR is lower than threshold.
- Combining with ADXR filters out some false breaks and enhances real trend signals.
The main innovation of this strategy is using ADXR indicator to identify trends in initial stage, and combining it with traditional moving average signals to improve quality and stability.
Advantages
The main advantages of the Dual Moving Average ADX Timing strategy:
- Combining dual MAs and ADXR, signals are more accurate and reliable with false signals filtered out.
- Identifying early trend by using ADXR to detect initial stage of trends.
- Flexible ADXR parameter tuning to adapt to changing market conditions.
- Simple and clear logic, easy to understand, convenient to adjust parameters.
- Applicable in various market environments with decent historical performance.
Risks
There are also several main risks for this strategy:
-
Improper ADXR parameter setting may lead to missing trades.
- Expand ADXR parameter range or adjust by products.
-
More false signals may occur in special market conditions.
- Consider combining with other indicators for further signal filtering.
-
Fixed EMA parameters fail to adapt to market changes.
- Test optimization version with adaptive EMA parameters.
-
Unable to identify trading ranges, may generate excessive insignificant trades.
- Add extra logic or indicators to detect ranging markets.
Enhancement Directions
The strategy can be further optimized and enhanced from the following aspects:
-
EMA parameter optimization for automatic adaptation to market conditions.
-
Expand ADXR parameter range for capturing more effective trading signals.
-
Add extra trend judgment indicators for combinational signals to improve quality.
-
Add stop loss strategies and take profit standards to control per trade risks.
-
Optimize money management for dynamic position sizing based on account status.
Conclusion
The Dual Moving Average ADX Timing strategy innovatively combines traditional dual moving averages and the ADXR indicator to improve signal quality and enhance stability. It can effectively identify the initial stage of trends with decent historical performance. The strategy has ample room for optimization to make it robust and profitable across more complex markets.
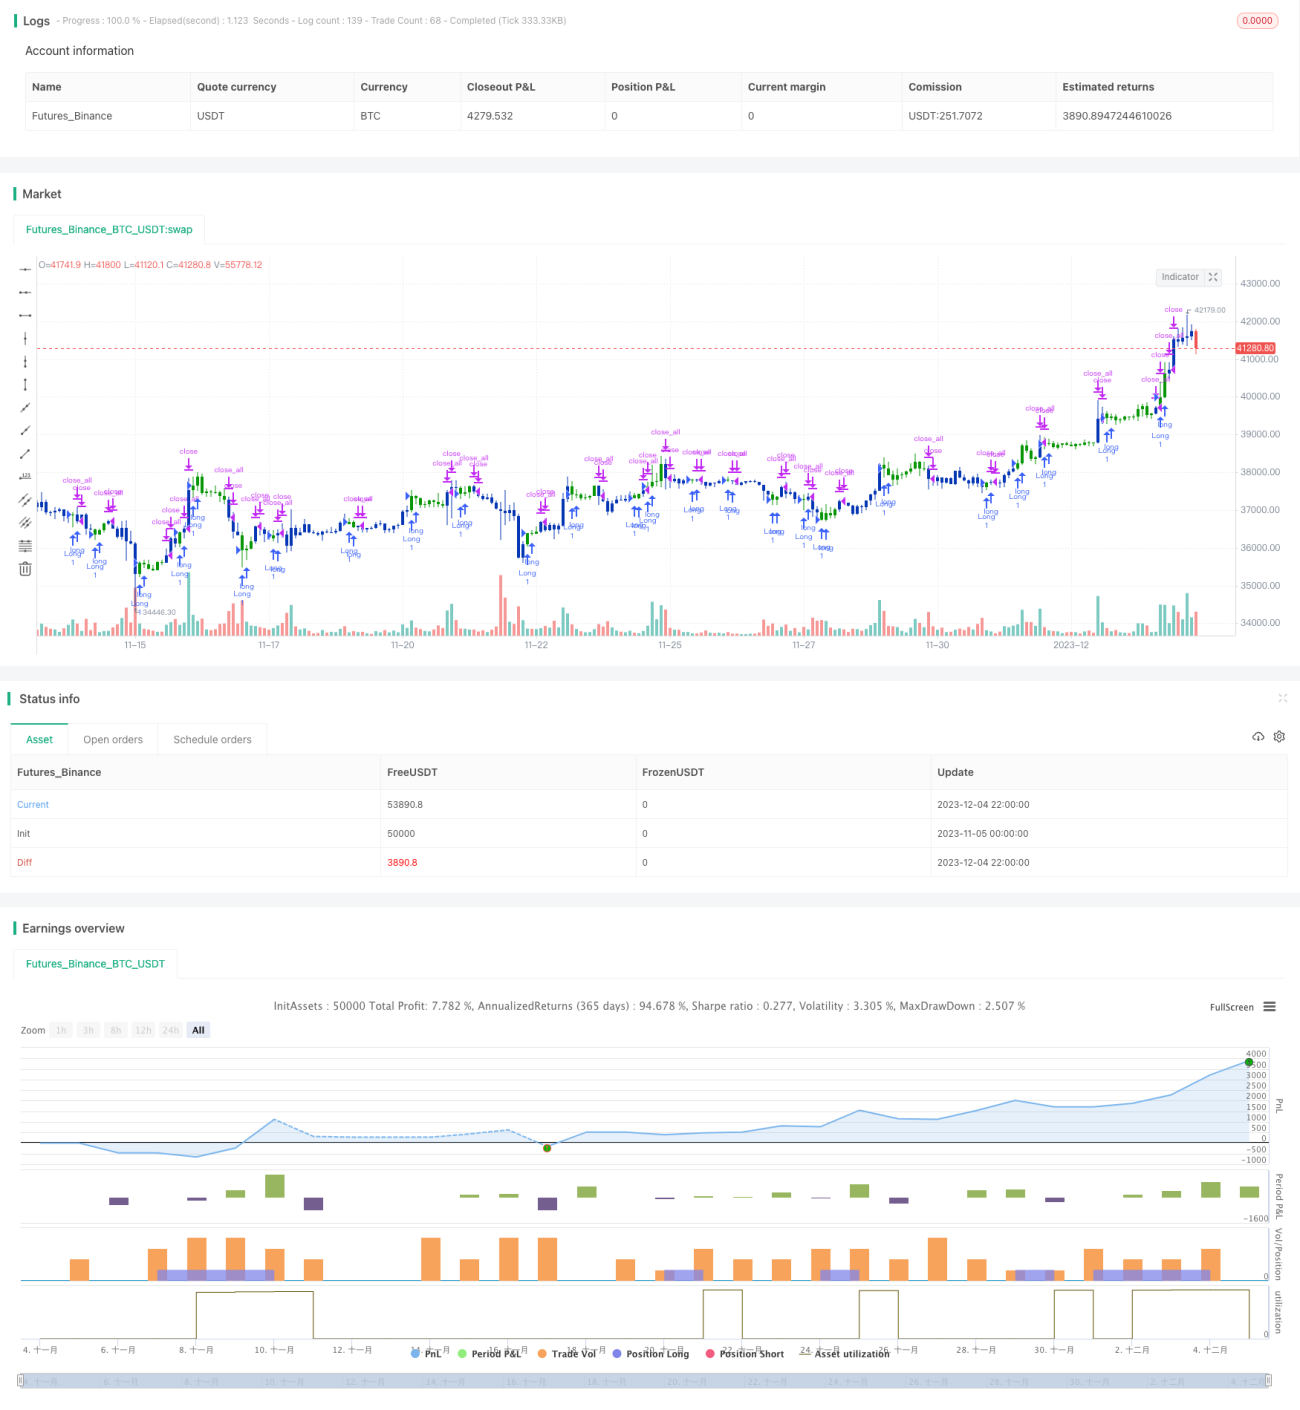
/*backtest
start: 2023-11-05 00:00:00
end: 2023-12-05 00:00:00
period: 2h
basePeriod: 15m
exchanges: [{"eid":"Futures_Binance","currency":"BTC_USDT"}]
*/

//@version=5
////////////////////////////////////////////////////////////
//  Copyright by HPotter v1.0 04/04/2022
// This is combo strategies for get a cumulative signal. - 1