Momentum Breakout Camarilla Support Strategy

Overview
This is a breakout trading strategy that combines momentum indicators and key support levels. It utilizes Camarilla pivots, moving average and price breakout to generate trading signals.
Strategy Logic
The core logic of the strategy is: when the price is near the key Camarilla support level and effectively breaks through that level, a buy signal is generated; when the price rises to the key Camarilla resistance level, a sell signal is generated.
Specifically, the strategy uses Camarilla support level L3 as the confirmation level for the buy signal. When the price is below L3 and below the midpoint of L3 and L2, the buy condition will be triggered. This indicates that the price is close to critical support and is likely to rebound. To filter out false breakouts, the strategy also sets the entry criteria that the closing price must be greater than the opening price.
The stop loss method of the strategy is to set a dynamic stop loss level. When the price exceeds the midpoint of the Camarilla resistance levels H1 and H2, the stop loss sell will be triggered. This dynamic stop loss level can trail stop loss based on market volatility.
Advantage Analysis
This is a reliable strategy that combines trends and support levels. Its advantages are:
- Use of key Camarilla levels that are proven important price levels.
- Combining trend filter to reduce being caught in trends. Only go long when EMA is bullish and only go short when EMA is bearish.
- Dynamic stop loss strategy adjusts stop level based on market volatility, with strong fault tolerance.
Risk Analysis
The strategy also has some risks:
- Camarilla levels may fail. These key levels may no longer apply when market structure changes.
- Stop loss is too aggressive. Small stops may be prematurely hit.
- Buy signals may appear on misleading pullbacks in downtrends, with risk of losses.
The counter measures are: adjust Camarilla parameters to better fit current market volatility range; appropriately widen stop loss range to prevent premature stop out; only short when in downtrend to avoid long trap.
Optimization Directions
Further optimization directions for this strategy include:
- Add additional filter conditions such as volume or elasticity indicators to avoid wrong direction entry.
- Optimize Camarilla parameters to make support/resistance levels fit better with current fluctuation range.
- Try different moving average parameters to find best parameter combination.
- Adjust aggressiveness of stops based on characteristics of different products.
Conclusion
This strategy comprehensively utilizes multiple dimensions like trend, support level, breakout to formulate entry and stop rules. It is a relatively robust breakout trading strategy. It combines the verification effectiveness of important Camarilla levels and the trend judgment of momentum indicators. This is aimed to capture trend trading opportunities in high probability areas. Meanwhile, dynamic stops are set to control risks. This strategy can increase our strategy library by an effective trend breakout strategy.
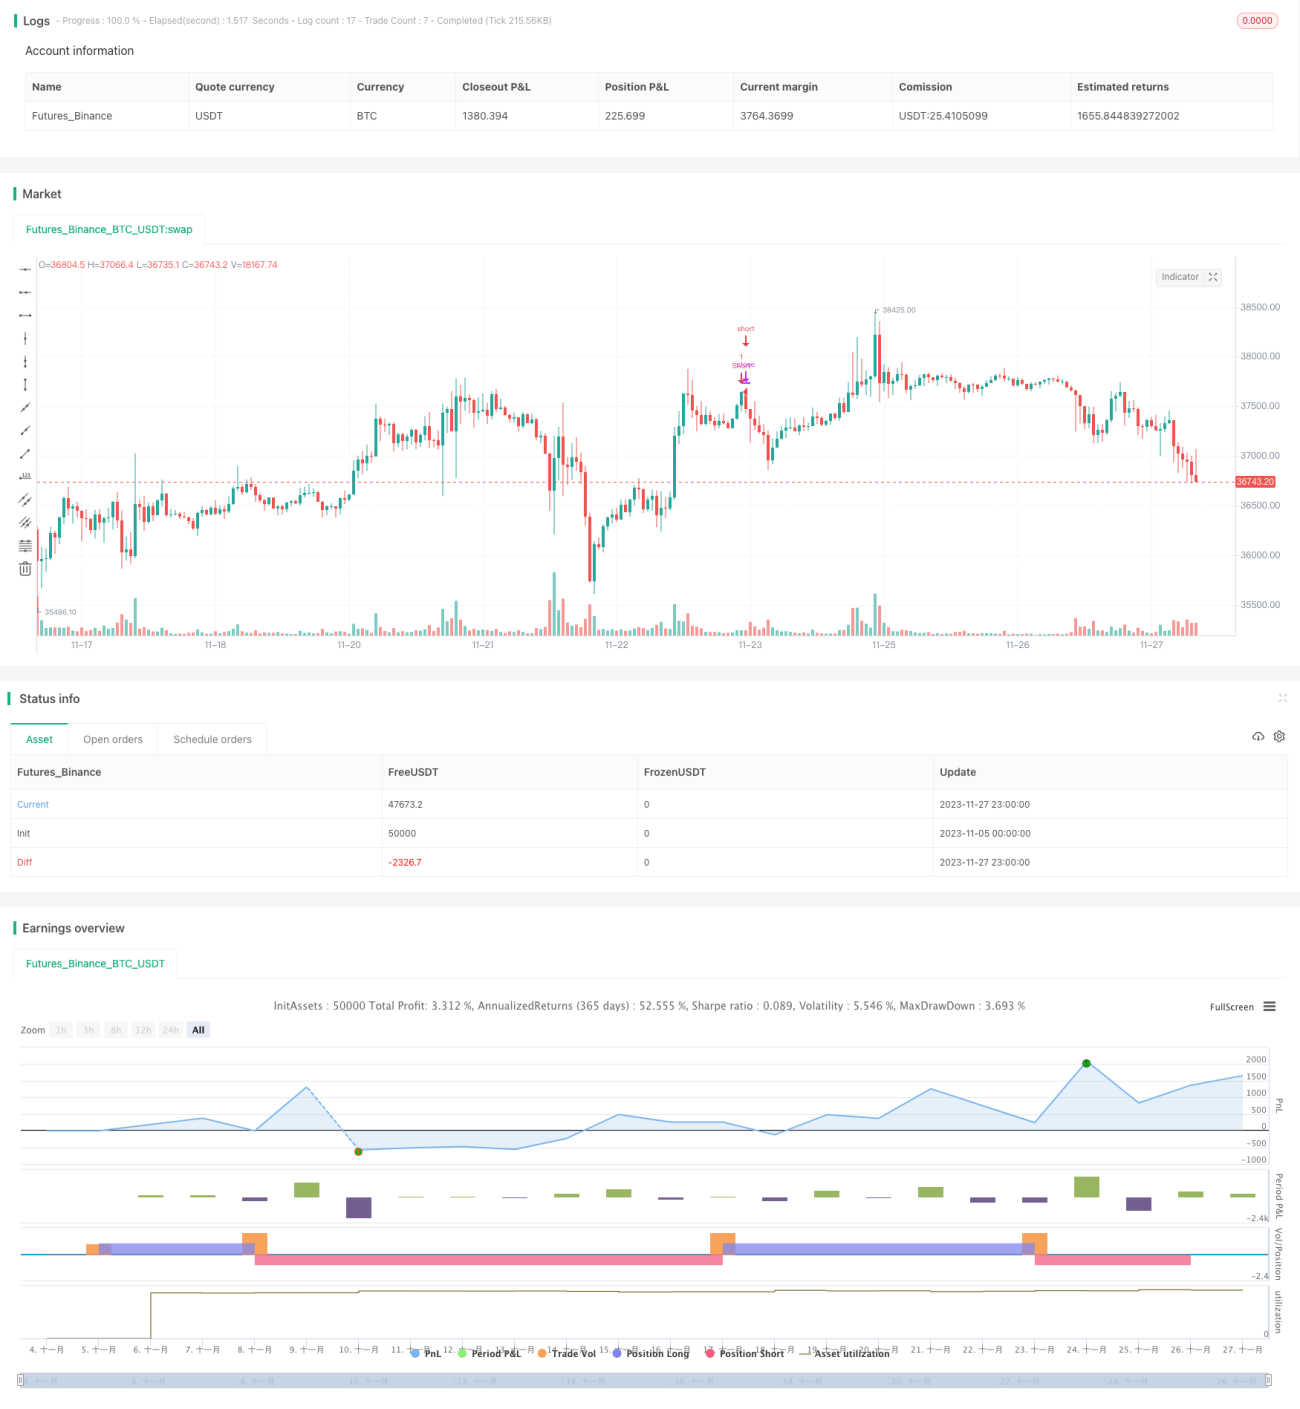
/*backtest
start: 2023-11-05 00:00:00
end: 2023-11-28 00:00:00
period: 1h
basePeriod: 15m
exchanges: [{"eid":"Futures_Binance","currency":"BTC_USDT"}]
*/

//@version=2
//Created by CristianD
strategy(title="CamarillaStrategyVhaouri", shorttitle="CD_Camarilla_StrategyV1", overlay=true)
//sd = input(true, title="Show Daily Pivots?")- 1