概述
双均线交叉交易策略通过计算不同时间周期的指数移动平均线,根据其交叉情况产生买入和卖出信号,属于趋势跟踪交易策略。该策略采用50周期、144周期和200周期三条移动平均线,根据它们的交叉情况判断市场趋势,产生交易信号。当短期移动平均线上穿中长期移动平均线时产生买入信号;当短期移动平均线下穿中长期移动平均线时产生卖出信号。该策略简单实用,容易实现自动化交易。
策略原理
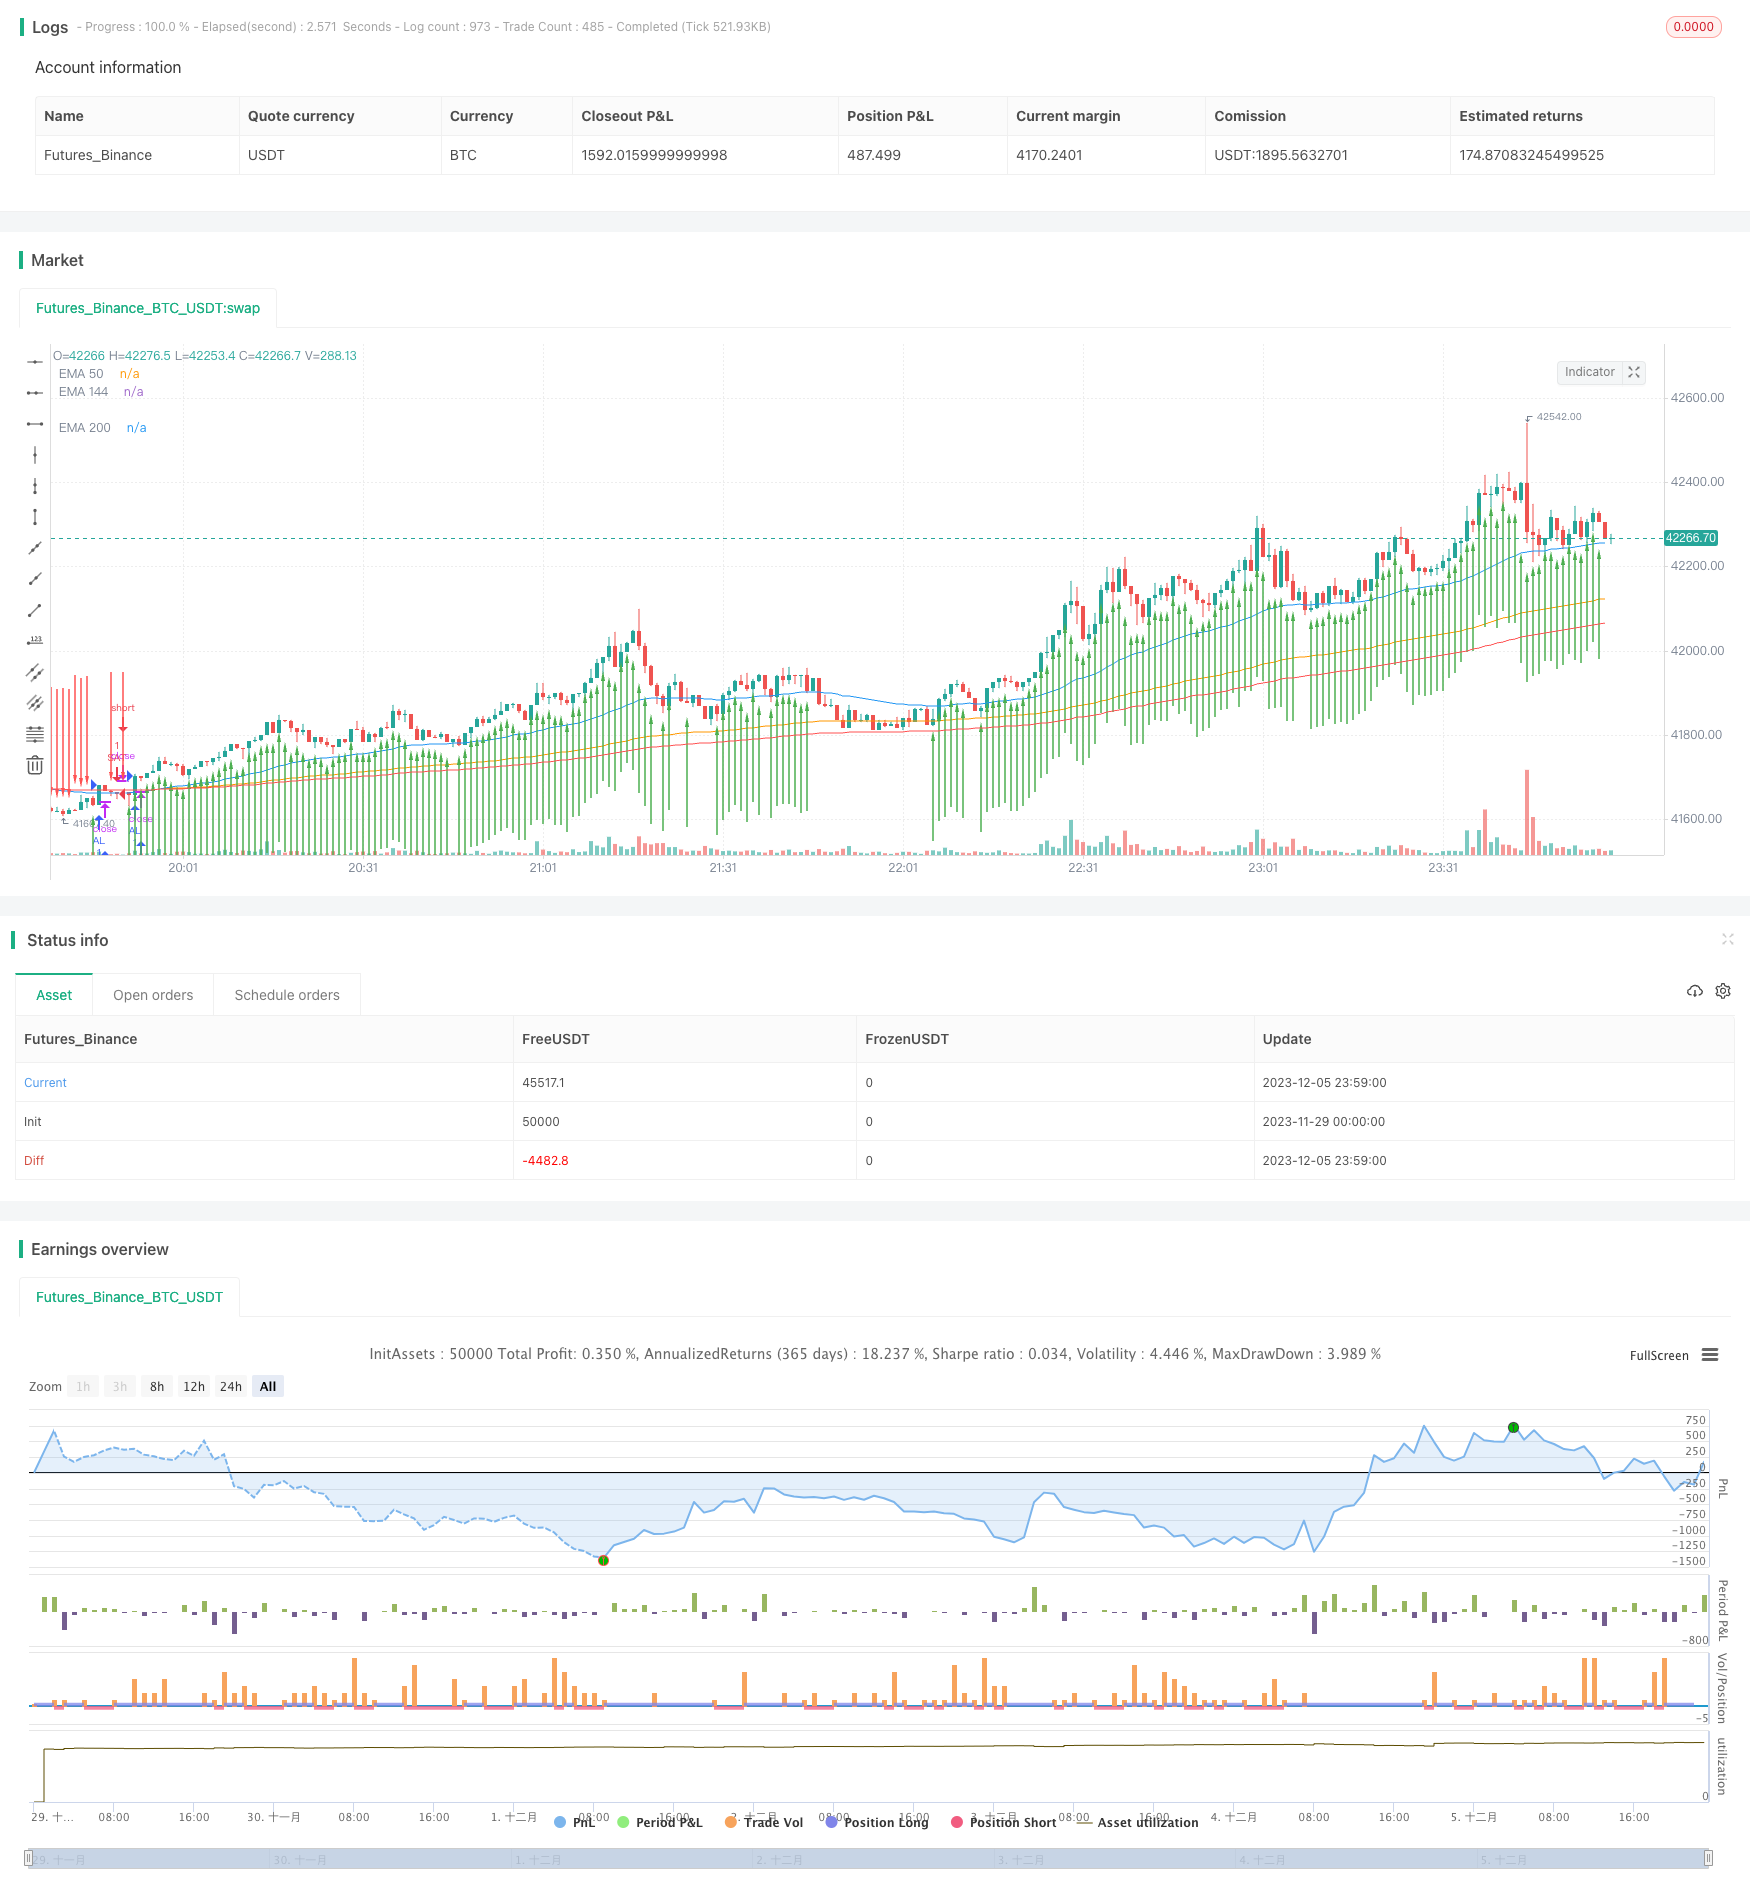
计算CLOSE收盘价的50周期、144周期和200周期的指数移动平均线,分别记为EMA50、EMA144和EMA200。
判断EMA50是否上穿EMA144和EMA200,如果同时上穿,产生买入信号,开多头仓位。
判断EMA50是否下穿EMA144和EMA200,如果同时下穿,产生卖出信号,平多头仓位。
优势分析
双均线交叉策略具有以下几个优势:
简单容易理解,参数设置简单,易于实现自动化。
响应迅速,能快速捕捉趋势的变化。
可自定义参数,调整均线周期,适应不同市场环境。
具有一定的去噪过滤能力,避免被短期波动误导。
可与其他指标或策略组合,构建规则系统。
风险分析
双均线交叉策略也存在一些风险:
容易产生假信号,被剧烈波动误导。
无法判断趋势的持续时间,可能过早入场或离场。
参数设置不当可能导致交易频繁,增加交易成本和滑点损失。
进入震荡趋势市场时,会产生连续亏损的情况。
无法控制交易风险,如止损退出。
优化方向
双均线交叉策略可以从以下几个方面进行优化:
结合其他指标过滤信号,如量能指标、震荡指标等,减少假信号。
添加止损策略,控制单笔交易风险。
优化移动平均线周期参数,适应不同周期的市场环境。
增加仓位管理模块,如固定数量开仓,加仓规则等。
结合机器学习等高级算法,动态优化策略参数。
总结
双均线交叉策略是一个简单实用的趋势跟踪策略。它通过EMA均线的交叉来判断趋势方向,以捕捉中长期趋势上的机会。该策略容易理解实现,但也存在产生假信号和控制风险的难题。通过引入其他指标组合,止损管理以及参数优化等手段,可以形成稳定且高效的交易系统。总的来说,双均线交叉策略适合自动化趋势跟踪交易,是量化交易的基础策略之一。
/*backtest
start: 2023-11-29 00:00:00
end: 2023-12-06 00:00:00
period: 1m
basePeriod: 1m
exchanges: [{"eid":"Futures_Binance","currency":"BTC_USDT"}]
*/

// This source code is subject to the terms of the Mozilla Public License 2.0 at https://mozilla.org/MPL/2.0/
// © SDTA

//@version=5
strategy("EMA Crossover Strategy", overlay=true)

// Hareketli Ortalamaları Hesapla
ema50 = ta.ema(close, 50)
ema144 = ta.ema(close, 144)
ema200 = ta.ema(close, 200)

// Al sinyali koşulu: Fiyat EMA 50, EMA 144 ve EMA 200 üzerine çıktığında
longCondition = close > ema50 and close > ema144 and close > ema200

// Sat sinyali koşulu: Fiyat EMA 200, EMA 144 ve EMA 50 altına indiğinde
shortCondition = close < ema200 and close < ema144 and close < ema50

// Al ve Sat sinyallerinin gerçekleştiği çubuğu ok ile belirt
plotarrow(series=longCondition ? 1 : shortCondition ? -1 : na, colorup=color.green, colordown=color.red, offset=-1, title="Trade Arrow")

// Hareketli Ortalamaları Çiz
plot(ema50, color=color.blue, title="EMA 50")
plot(ema144, color=color.orange, title="EMA 144")
plot(ema200, color=color.red, title="EMA 200")

// Strateji testi ekleyin
strategy.entry("AL", strategy.long, when=longCondition)
strategy.entry("SAT", strategy.short, when=shortCondition)