Dynamic Momentum Strategy

Overview
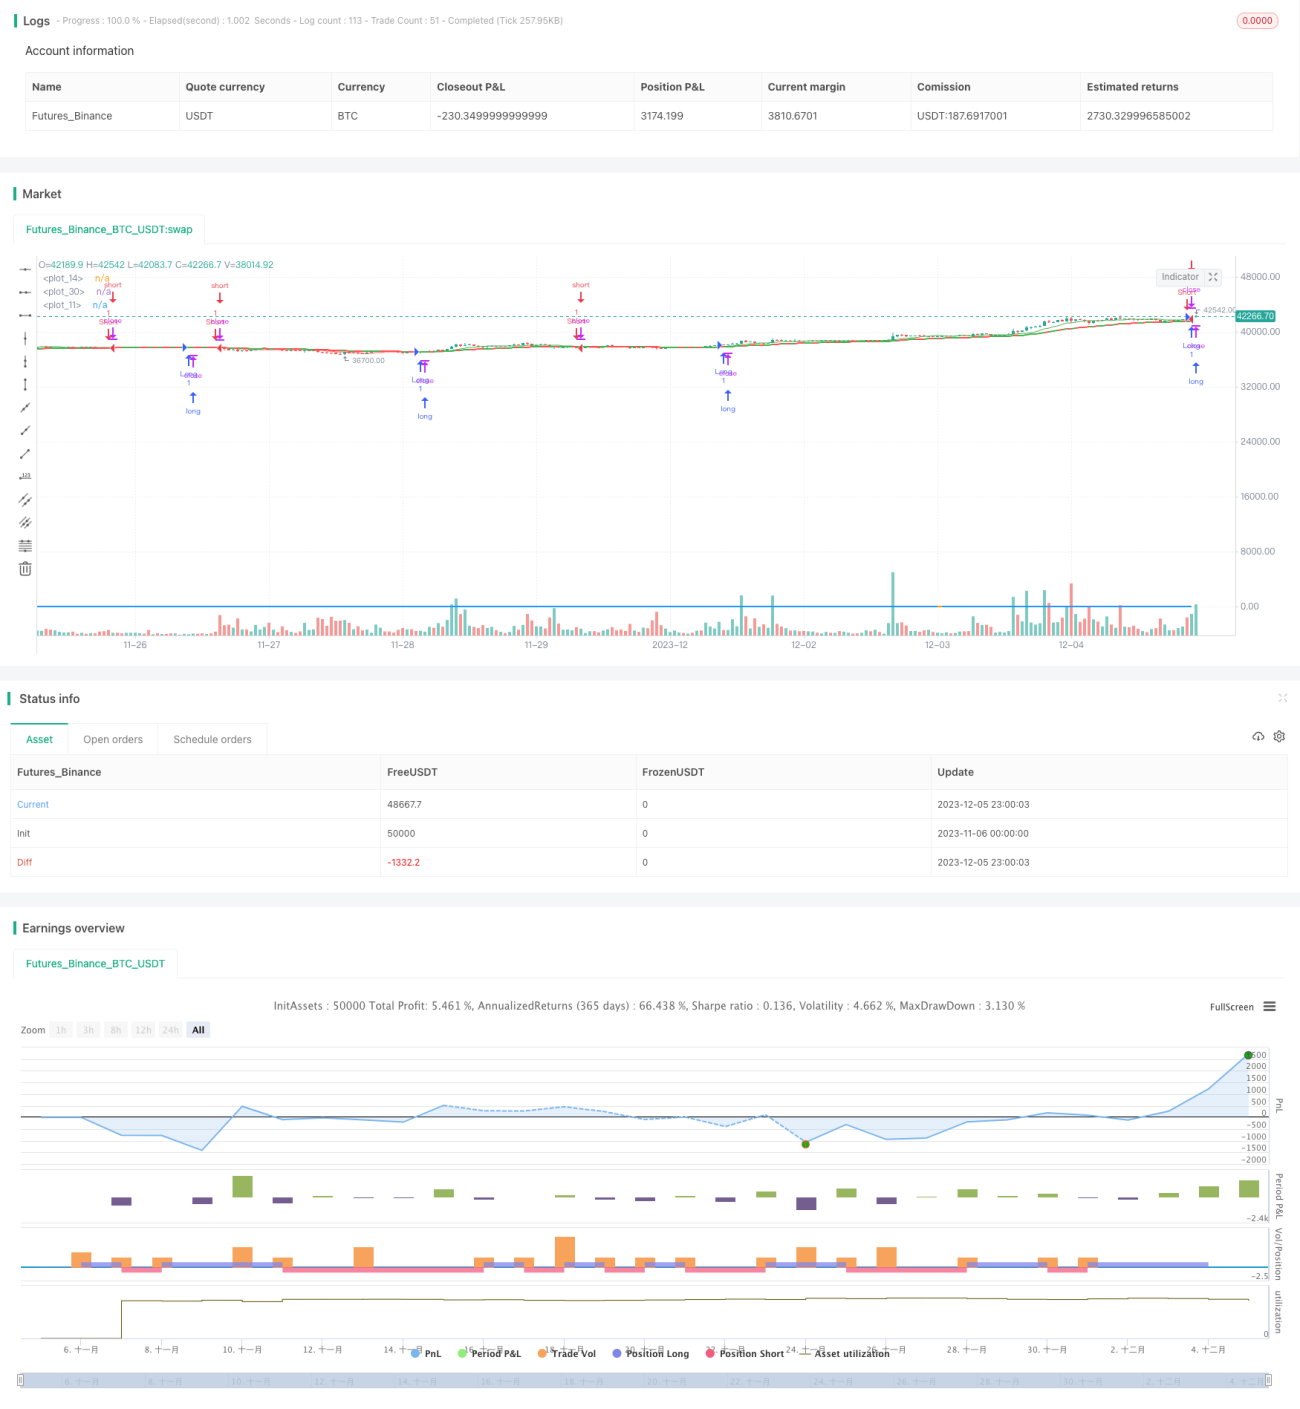
The strategy calculates and plots the 14-day simple moving average (SMA) and 28-day SMA. It goes long when the two lines have a golden cross and goes short when there is a death cross, in order to capture changes in market momentum.
Strategy Logic
The core indicators of this strategy are the 14-day SMA and 28-day SMA. The 14-day SMA responds quickly to price changes, reflecting short-term trends. The 28-day SMA is more stable, reflecting medium-term trends. When the shorter SMA crosses over the longer SMA, it indicates the short-term trend is stronger than the long-term trend. Going long can capture the upside momentum. When the shorter SMA crosses below the longer SMA, it indicates the long-term trend is weakening. Going short can capture the downside momentum.
Using SMA crosses to determine long/short positions is a common trading signal. Compared to a single SMA indicator, the dual SMA cross combines information from different time horizons and avoids false signals.
Advantage Analysis
The advantages of this strategy include:
- Simple to implement and operate.
- Quickly responds to price changes and catches market turns.
- Combines short-term and medium-term information for relatively reliable signals.
- SMA parameters can be adjusted to adapt to different markets.
Risk Analysis
There are also some risks:
- SMA itself has lagging effect, signals may be delayed.
- Cannot handle extreme market volatility like flash crashes.
- More SMA crosses increase trading frequency and costs.
- Simple entry/exit rules have room for optimization.
Risk management measures include: allowing wider stops, emphasizing risk control; adjusting SMA periods based on market; combining other filters.
Optimization Directions
The strategy can be improved in areas like:
- Add filters to avoid false crosses. Confirm with volume, Stochastic etc.
- Add stop loss mechanisms. Such as ATR stops, breakout stops.
- Optimize SMA periods. Such as adaptive SMA, ML parameter selection.
- Combine with other strategy types. Such as drawdown control, trend following to make combo strategies.
Conclusion
The momentum SMA cross strategy dynamically captures changing market trends by calculating dual SMA cross signals. It is easy to implement and responds quickly, but also has lagging risk. Future improvements can be made in confirming signals, stop losses, parameter selection etc, or combine with other strategies for better results.
- 1