Bollinger Bands Reversal Trend Strategy

1
Follow
1779
Followers
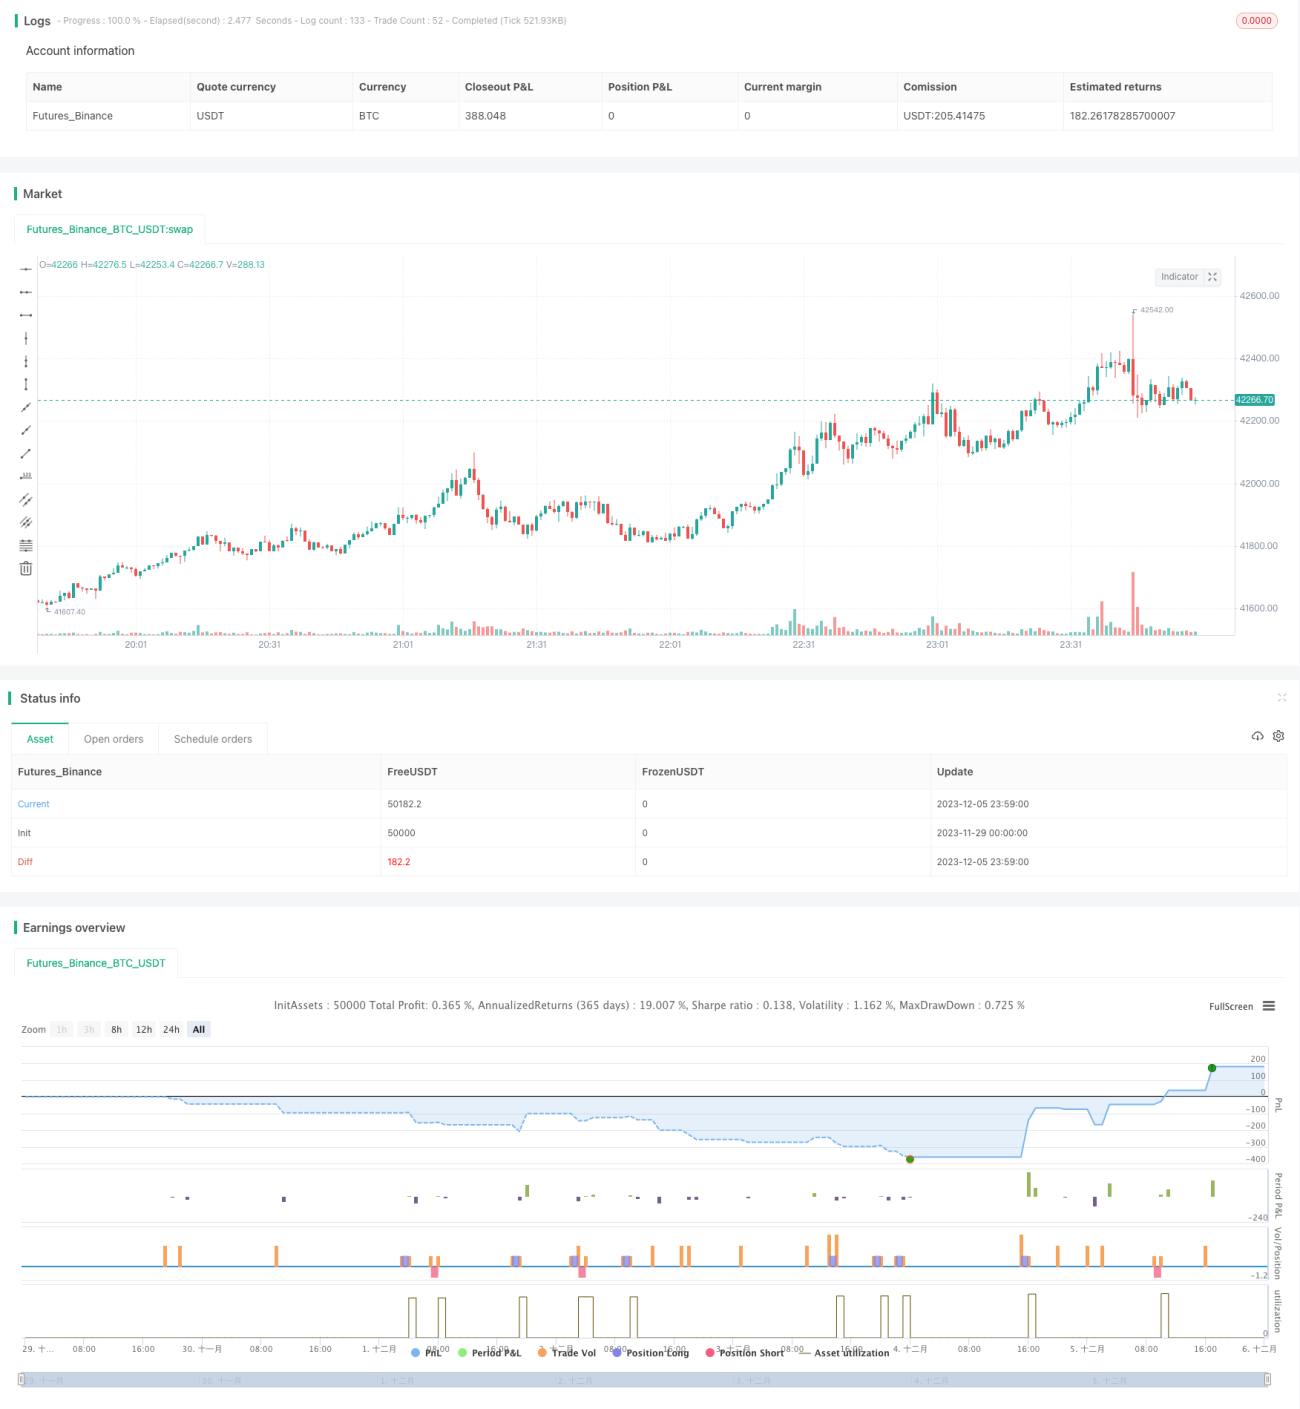
Overview
This strategy uses the relationship between the upper band, middle band, lower band of Bollinger Bands and 200-day moving average to determine the trend direction. It goes long when price touches the lower band during an uptrend and goes short when price touches the upper band during a downtrend.
Principles
- Determine trend: When both upper and lower bands of Bollinger Bands are above 200-day moving average, it is an uptrend. When both are below, it is a downtrend.
- Entry: Go long when price touches lower band in an uptrend. Go short when price touches upper band in a downtrend.
- Exit: When long, close position when price touches upper band or breaks below 250-day simple moving average. When short, close position when price touches lower band or breaks above 300-day simple moving average.
Advantages
- Use Bollinger Bands to determine trend direction, avoiding repetitive trading without a clear direction.
- Take proper entries and exits based on the volatility range of Bollinger Bands when trend direction is clear.
- Added filtering with moving averages, avoiding unexpected losses.
Risks and Solutions
- Improper Bollinger Bands parameter setting leads to misjudgment: Adjust parameters to find the optimal period length.
- Improper moving average parameter leading to over trading or unwanted losses: Test different parameters to find the most stable ones.
- Sudden market change due to major news events causes anomalies: Set stop loss to limit per trade loss.
Optimization Directions
- Test strategy performance across different parameter periods to find the optimal parameters.
- Add stop loss mechanism to avoid huge losses in anomalous market conditions.
- Incorporate other indicators to confirm entry signals to improve win rate.
Conclusion
This strategy determines trend direction with Bollinger Bands first. It then utilizes the volatility range of Bollinger Bands together with moving averages to form a trading system that ensures directional correctness and locks in decent profits. There are still some issues with parameter selection and stop loss that can be further improved via optimization and mechanism additions to achieve better performance.
Source
Pine
Strategy parameters
Related strategies
Comment
All comments (0)
No data
- 1