基于MACD指标的双向交易策略


创建日期: 2023-12-07 17:11:52 最后修改: 2023-12-07 17:11:52
复制: 0 点击次数: 559
avatar of ChaoZhang ChaoZhang
1
关注
1260
关注者

基于MACD指标的双向交易策略

概述

该策略基于MACD指标实现了一个双向交易策略。它可以在MACD指标上金叉和死叉的时候分别做多和做空,并结合其他指标判断来过滤掉一些信号。

策略原理

该策略主要利用MACD指标实现双向交易。具体来说,它会计算快速移动平均线、慢速移动平均线和MACD信号线。当快速移动平均线上穿慢速移动平均线时生成金叉信号做多;当快速移动平均线下穿慢速移动平均线时生成死叉信号做空。

为了过滤掉部分无效信号,该策略还设置了一个±30范围作为过滤器,只有在MACD柱状线超出这个范围的时候才会触发交易信号。此外,在平仓的时候也会判断MACD柱状线的方向,只有连续两个柱子的方向发生转变的时候才会平仓。

策略优势

  • 使用MACD指标作为主要交易信号,该指标对双向股票市场行情都比较敏感
  • 增加了滤波器,可以过滤掉部分无效信号
  • 采用了连续两个柱子方向判断的平仓逻辑,可以一定程度避免假突破

策略风险

  • MACD指标容易产生频繁交易信号,可能带来过高的交易频率
  • 单一指标策略,信号稍有延迟就可能导致亏损
  • 柱状线方向判断的平仓逻辑不够严谨,可能存在信号漏失的风险

策略优化方向

  • 可以考虑结合其他指标来确认信号,如KDJ指标、布林带指标等
  • 可以研究其他更先进的指标来替代MACD指标,如KD指标
  • 可以优化平仓逻辑,设置止损和止盈,以控制单笔亏损

总结

本策略总的来说是一个基本可用的双向交易策略。它利用MACD指标的优势,同时也增加了一定的过滤器来控制信号的质量。但MACD指标本身也存在一些问题,在实盘中仍需要进一步的测试和优化,才能使策略更加可靠。总体而言,本策略为双向交易策略奠定了基础,后续可在此基础上不断优化,使之成为一个强大的量化交易策略。

]

策略源码
/*backtest
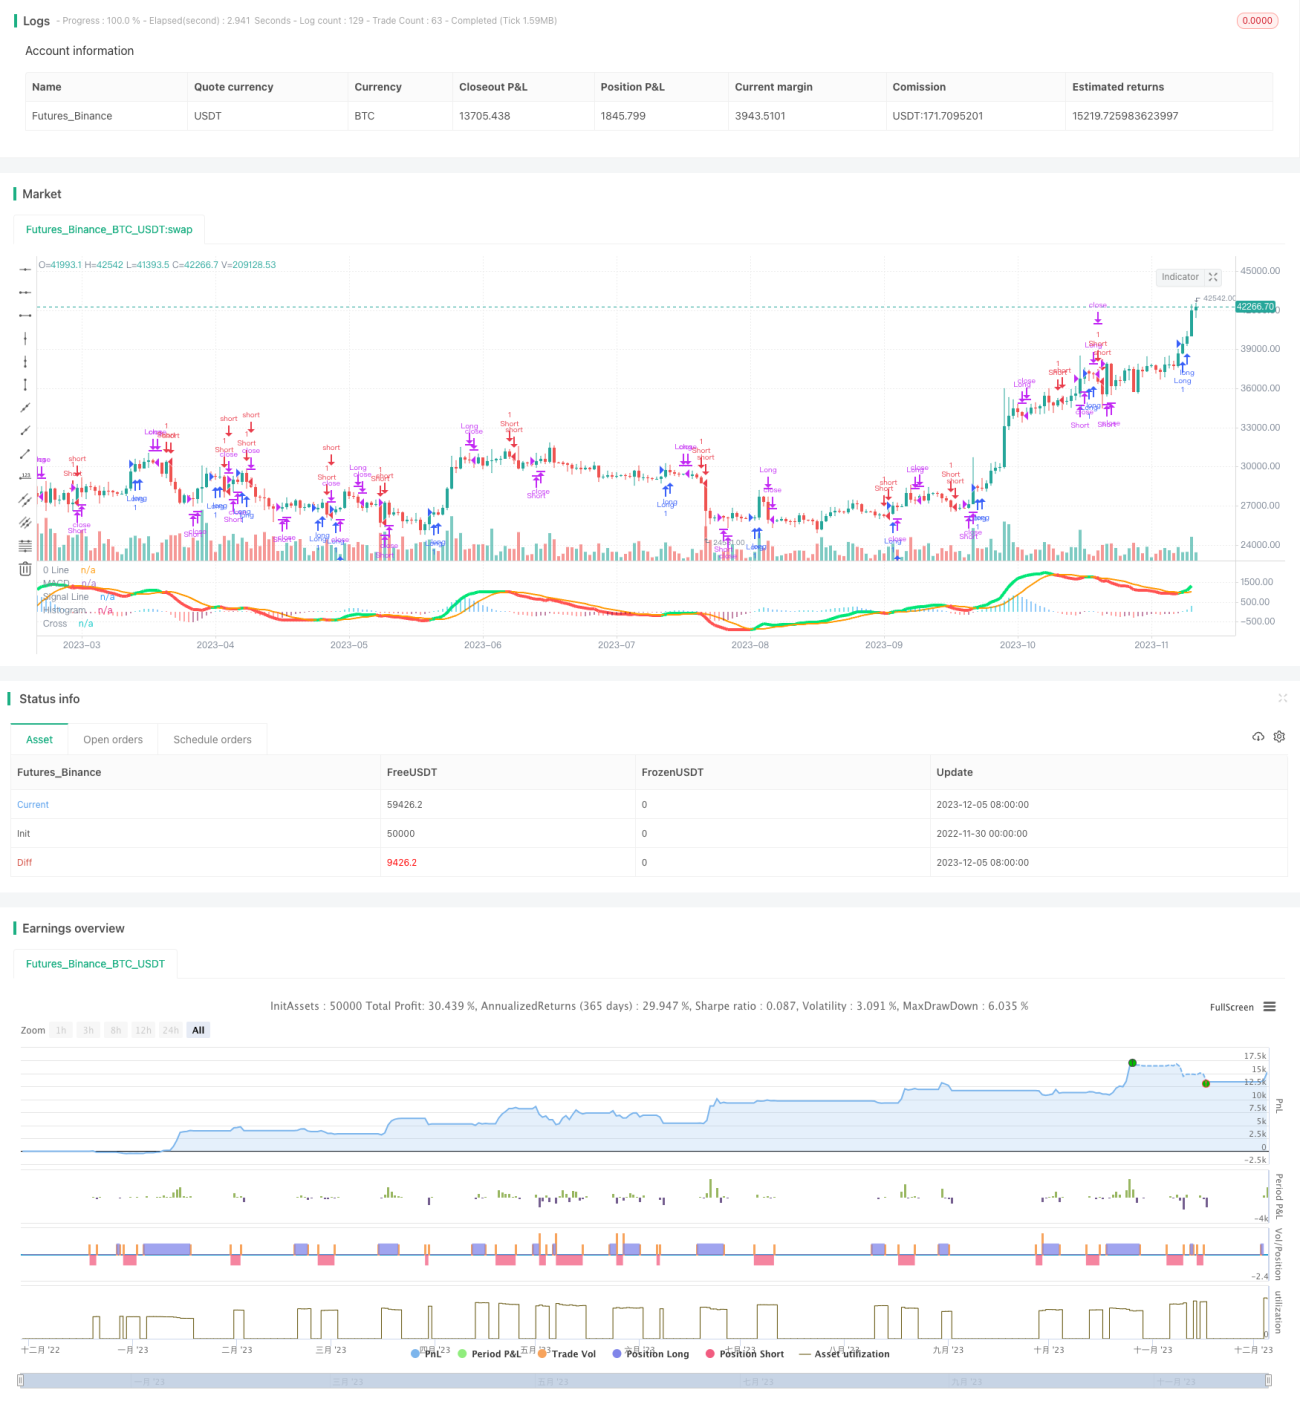
start: 2022-11-30 00:00:00
end: 2023-12-06 00:00:00
period: 1d
basePeriod: 1h
exchanges: [{"eid":"Futures_Binance","currency":"BTC_USDT"}]
*/

//@version=3

//Created by user ChrisMoody updated 4-10-2014
//Regular MACD Indicator with Histogram that plots 4 Colors Based on Direction Above and Below the Zero Line
//Update allows Check Box Options, Show MacD & Signal Line, Show Change In color of MacD Line based on cross of Signal Line.
//Show Dots at Cross of MacD and Signal Line, Histogram can show 4 colors or 1, Turn on and off Histogram.
//Special Thanks to that incredible person in Tech Support whoem I won't say you r name so you don't get bombarded with emails
//Note the feature Tech Support showed me on how to set the default timeframe of the indicator to the chart Timeframe, but also allow you to choose a different timeframe.
//By the way I fully disclose that I completely STOLE the Dots at the MAcd Cross from "TheLark"

strategy("MACD Strategy", overlay=false)
// study(title="CM_MacD_Ult_MTF", shorttitle="CM_Ult_MacD_MTF")
source = close
useCurrentRes = input(true, title="Use Current Chart Resolution?")
resCustom = input(title="Use Different Timeframe? Uncheck Box Above", defval="60")
smd = input(true, title="Show MacD & Signal Line? Also Turn Off Dots Below")
sd = input(true, title="Show Dots When MacD Crosses Signal Line?")
sh = input(true, title="Show Histogram?")
macd_colorChange = input(true,title="Change MacD Line Color-Signal Line Cross?")
hist_colorChange = input(true,title="MacD Histogram 4 Colors?")

res = useCurrentRes ? timeframe.period : resCustom

fastLength = input(12, minval=1), slowLength=input(26,minval=1)
signalLength=input(9,minval=1)

fastMA = ema(source, fastLength)
slowMA = ema(source, slowLength)

macd = fastMA - slowMA
signal = sma(macd, signalLength)
hist = macd - signal

outMacD = request.security(syminfo.tickerid, res, macd)
outSignal = request.security(syminfo.tickerid, res, signal)
outHist = request.security(syminfo.tickerid, res, hist)

histA_IsUp = outHist > outHist[1] and outHist > 0
histA_IsDown = outHist < outHist[1] and outHist > 0
histB_IsDown = outHist < outHist[1] and outHist <= 0
histB_IsUp = outHist > outHist[1] and outHist <= 0

//MacD Color Definitions
macd_IsAbove = outMacD >= outSignal
macd_IsBelow = outMacD < outSignal


// strategy.entry("Long", strategy.long, 1, when = shouldPlaceLong) 
       
// strategy.close("Long", shouldExitLong)
    

// strategy.entry("Short", strategy.short, 1, when = shouldPlaceShort) 
       
// strategy.close("Short", shouldExitShort)
    
    
isWithinZeroMacd = outHist < 30 and outHist > -30 

delta = hist
// shouldExitShort = false//crossover(delta, 0)    
// shouldExitLong = false//crossunder(delta, 0)

// if(crossover(delta, 0))// and not isWithinZeroMacd)
//     strategy.entry("Long", strategy.long, comment="Long")

// if (crossunder(delta, 0))// and not isWithinZeroMacd)
//     strategy.entry("Short", strategy.short, comment="Short")
    
shouldPlaceLong = crossover(delta, 0)
    
strategy.entry("Long", strategy.long, 1, when = shouldPlaceLong) 

shouldExitLong = not histA_IsUp and histA_IsDown

shouldExitShort = not histA_IsUp and not histA_IsDown and not histB_IsDown and histB_IsUp

shouldPlaceShort = crossunder(delta, 0)
strategy.entry("Short", strategy.short, 1, when = shouldPlaceShort) 
       
// plot_color = gray
plot_color = if(hist_colorChange)
	if(histA_IsUp)
	    aqua
	else
		if(histA_IsDown)
			//need to sell
// 			if(not isWithinZeroMacd)
// 			shouldExitLong = true
			    //   strategy.entry("Short", strategy.short, comment="Short")
			
			blue
		else
			if(histB_IsDown)
				red 
			else
				if(histB_IsUp)
					//need to buy
				// 	if(not isWithinZeroMacd)
				// 	shouldExitShort = true
					   // strategy.entry("Long", strategy.long, comment="Long")
					    
					    
					maroon
				else
					yellow
else
	gray


// plot_color = hist_colorChange ? histA_IsUp ? aqua : histA_IsDown ? blue : histB_IsDown ? red : histB_IsUp ? maroon :yellow :gray
macd_color = macd_colorChange ? macd_IsAbove ? lime : red : red
signal_color = macd_colorChange ? macd_IsAbove ? orange : orange : lime

circleYPosition = outSignal

plot(smd and outMacD ? outMacD : na, title="MACD", color=macd_color, linewidth=4)
plot(smd and outSignal ? outSignal : na, title="Signal Line", color=signal_color, style=line ,linewidth=2)
plot(sh and outHist ? outHist : na, title="Histogram", color=plot_color, style=histogram, linewidth=4)
plot(sd and cross(outMacD, outSignal) ? circleYPosition : na, title="Cross", style=circles, linewidth=4, color=macd_color)

// plot( isWithinZeroMacd ? outHist : na, title="CheckSmallHistBars", style=circles, linewidth=4, color=black)

hline(0, '0 Line',  linewidth=2, color=white)


strategy.close("Short", shouldExitShort)
strategy.close("Long", shouldExitLong)

// fastLength = input(12)
// slowlength = input(26)
// MACDLength = input(9)

// MACD = ema(close, fastLength) - ema(close, slowlength)
// aMACD = ema(MACD, MACDLength)
// delta = MACD - aMACD


// if (crossover(delta, 0))
   // strategy.entry("MacdLE", strategy.long, comment="MacdLE")

//if last two macd bars are higher than current, close long position

// if (crossunder(delta, 0))
   // strategy.entry("MacdSE", strategy.short, comment="MacdSE")

//if last two macd bars are higher than current, close long position

// plot(strategy.equity, title="equity", color=red, linewidth=2, style=areabr)