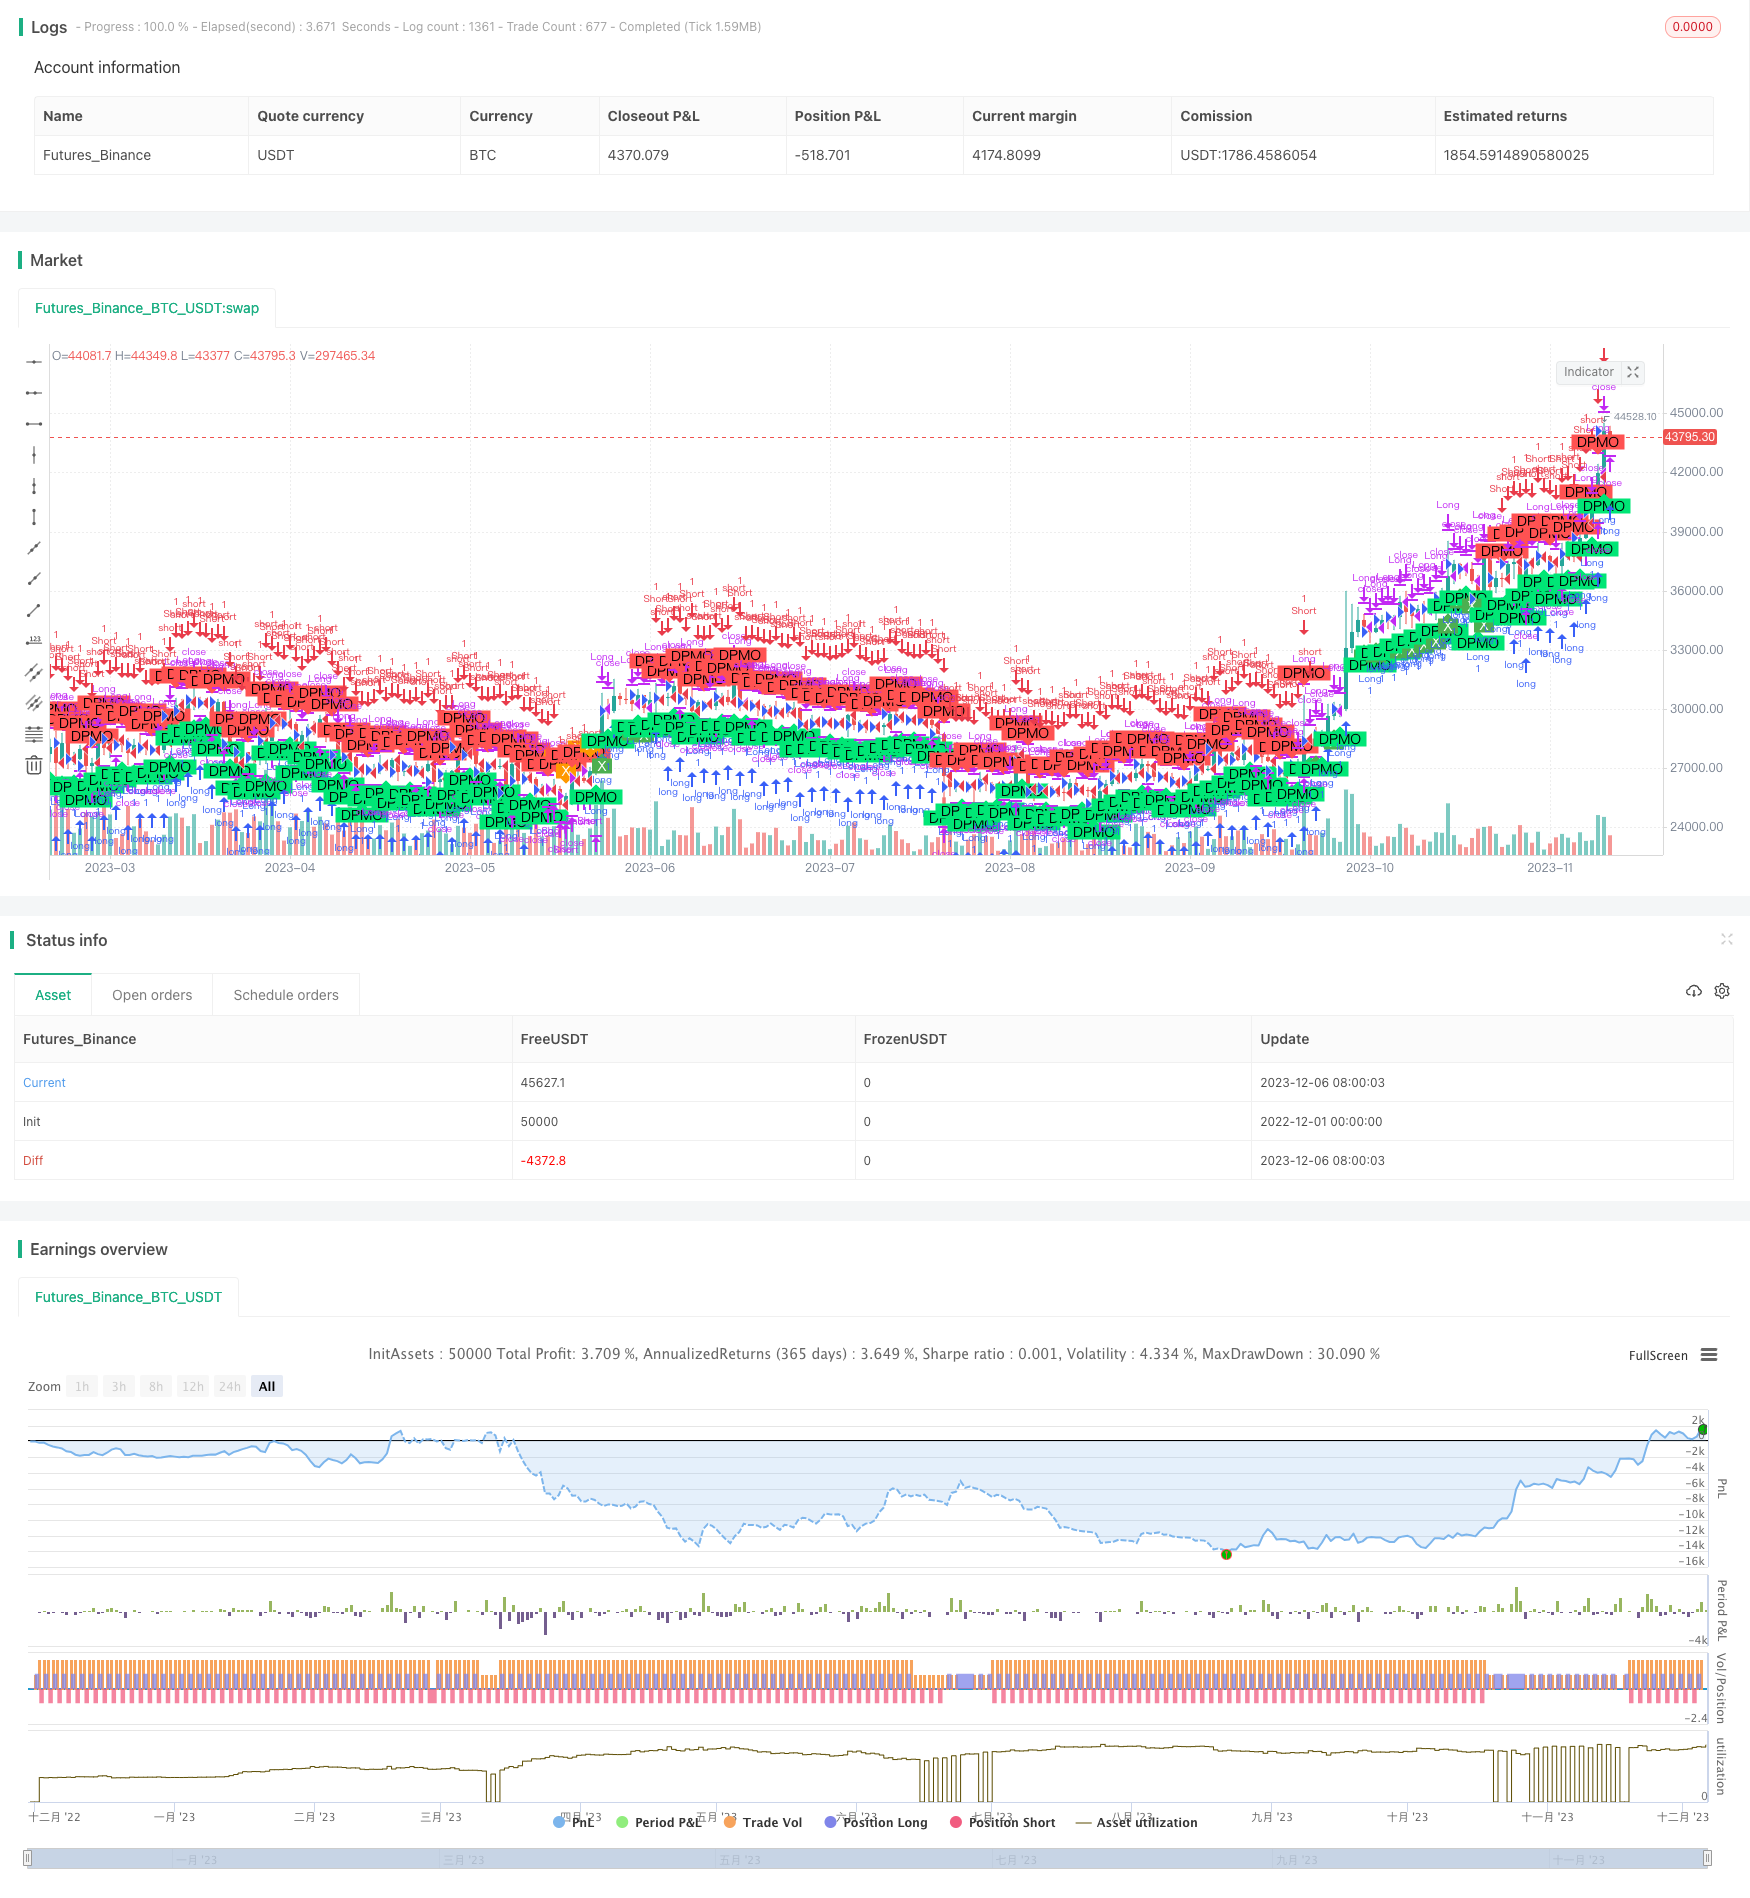
概述
本策略的核心思想是利用价格的波动率来判断市场的趋势,当波动率上升时,表示市场正在形成新的趋势;当波动率下降时,表示当前趋势正在结束。策略通过计算价格的百分比变化,然后对其进行双均线滤波,得到反映价格波动率的指标。当该指标上穿其信号线时产生买入信号,下穿其信号线时产生卖出信号。
策略原理
该策略首先计算价格的百分比变化:
i=(src/nz(src[1], src))*100
然后通过一个长度为35的均线滤波,得到初级的价格波动率指标pmol2。再通过一个长度为20的均线对pmol2进行二次滤波,得到最终的价格波动率指标pmol。最后,通过一个长度为10的均线得到pmol的信号线pmols。 当pmol上穿pmols时,产生买入信号;当pmol下穿pmols时,产生卖出信号。
优势分析
- 利用双均线滤波,可较好地提取价格波动率,过滤噪音。
- 计算价格的百分比变化,可放大价格变化,更清晰地反映趋势变化。
- 获利方式比较明确:趋势开始买入,趋势结束卖出。
风险分析
- 双均线滤波会带来一定程度的滞后。
- 百分比变化计算方式对价格幅度较敏感。
- 牛熊转换时,须及时平仓。
优化方向:
- 优化均线参数,提高对趋势的捕捉。
- 尝试不同的价格变化计算方式。
- 增加过滤条件,避免错误信号。
总结
本策略通过计算百分比变化和双均线滤波的方式,提取价格波动率,判断市场趋势变化,属于较为成熟的技术指标类策略。该策略捕捉趋势的能力较强,但识别转换点能力一般。可通过调整参数和增加辅助条件来优化。
策略源码
/*backtest
start: 2022-12-01 00:00:00
end: 2023-12-07 00:00:00
period: 1d
basePeriod: 1h
exchanges: [{"eid":"Futures_Binance","currency":"BTC_USDT"}]
*/

//@version=2
strategy("Strategy for DPMO", overlay=true)

src=input(close, title="Source")
length1=input(35, title="First Smoothing")
length2=input(20, title="Second Smoothing")
siglength=input(10, title="Signal Smoothing")
ebc=input(false, title="Enable Bar Colors")

upSign = '↑' // indicates the indicator shows uptrend
downSign = '↓' // incicates the indicator showing downtrend
exitSign ='x' //indicates the indicator uptrend/downtrend ending

calc_csf(src, length) =>
	sm = 2.0/length
	csf=(src - nz(csf[1])) * sm + nz(csf[1])
	csf
i=(src/nz(src[1], src))*100
pmol2=calc_csf(i-100, length1)
pmol=calc_csf( 10 * pmol2, length2)
pmols=ema(pmol, siglength)
d=pmol-pmols
hc=d>0?d>d[1]?lime:green:d<d[1]?red:orange

buyDPMO = hc==lime and hc[1]!=lime
closeBuyDPMO = hc==green and hc[1]!=green
sellDPMO = hc==red and hc[1]!=red
closeSellDPMO = hc==orange and hc[1]!=orange

plotshape(buyDPMO, color=lime, style=shape.labelup, textcolor=#000000, text="DPMO", location=location.belowbar, transp=0)
plotshape(closeBuyDPMO, color=green, style=shape.labelup, textcolor=#ffffff,  text="X", location=location.belowbar, transp=0)
plotshape(sellDPMO, color=red, style=shape.labeldown, textcolor=#000000, text="DPMO", location=location.abovebar, transp=0)
plotshape(closeSellDPMO, color=orange, style=shape.labeldown, textcolor=#ffffff,  text="X", location=location.abovebar, transp=0)
barcolor(ebc?hc:na)


strategy.entry("Long", strategy.long, when=buyDPMO)
strategy.close("Long", when=closeBuyDPMO or sellDPMO)
strategy.entry("Short", strategy.short, when=sellDPMO)
strategy.close("Short", when=closeSellDPMO or buyDPMO)