Index Trading Strategy Based on Bollinger Bands

Overview
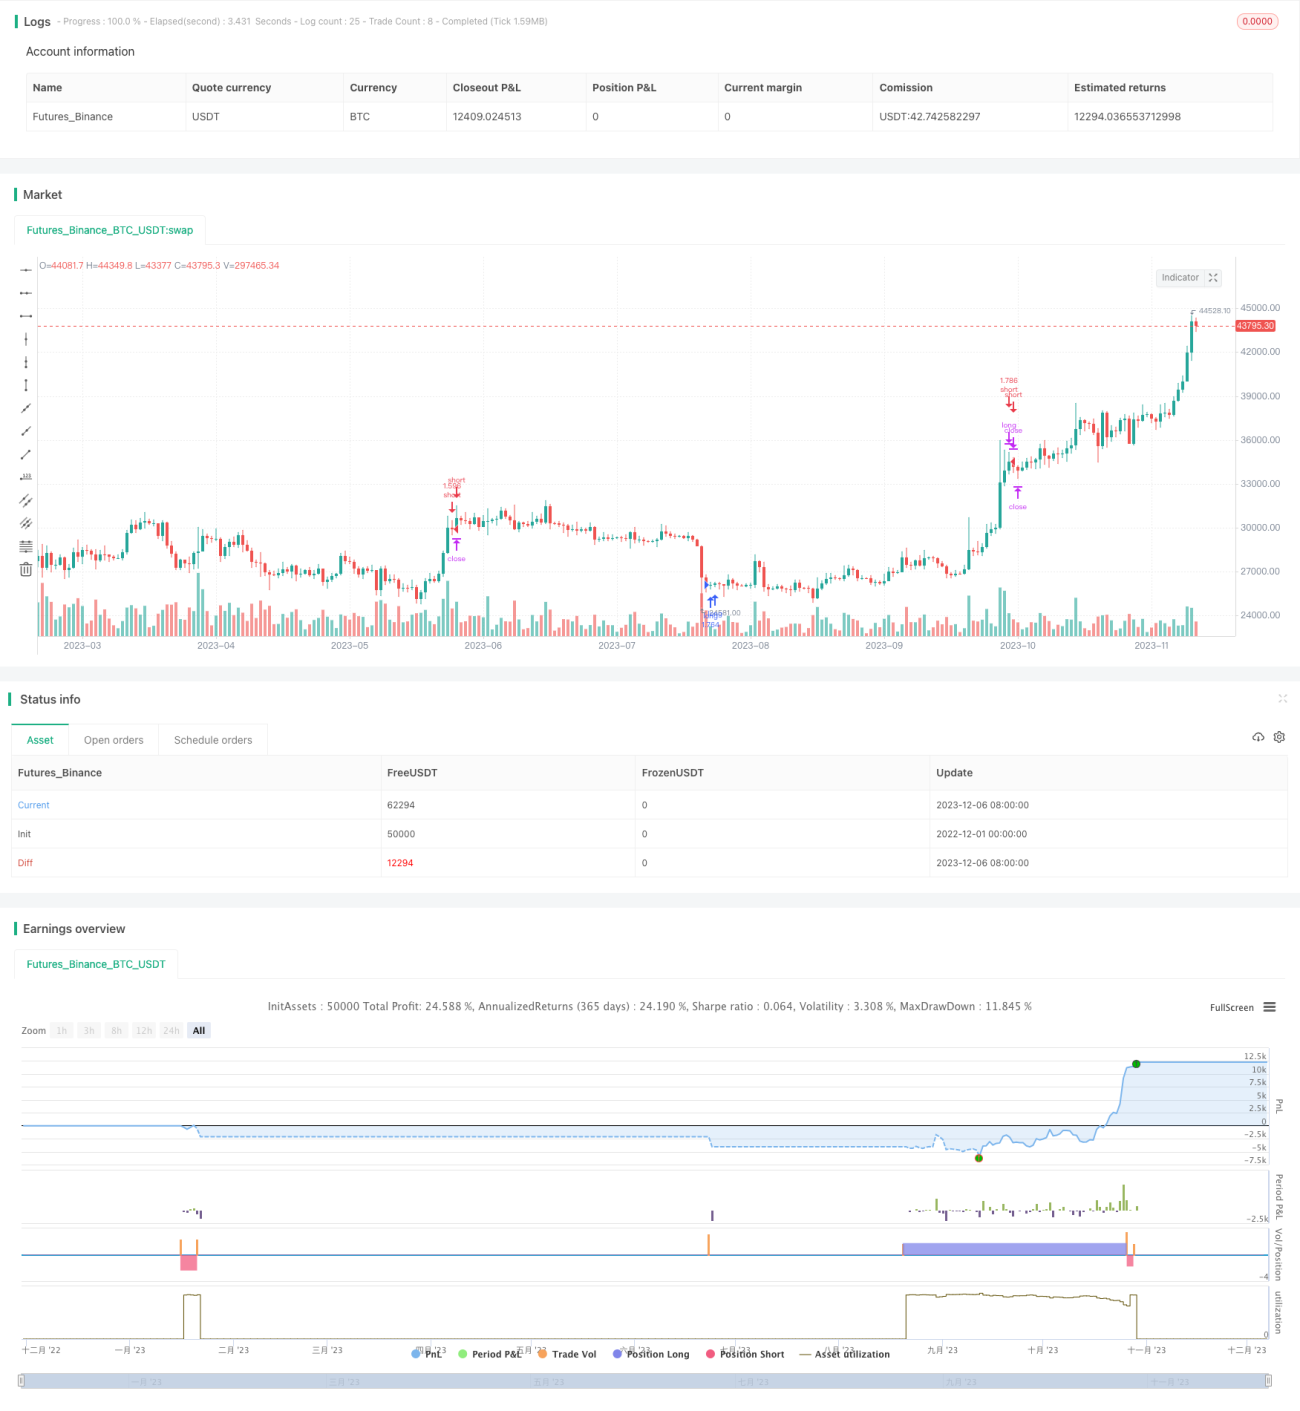
The strategy is named "Quant Trading Strategy Based on Bollinger Bands". It is an index and stock trading strategy based on improved Bollinger Bands channel. By adjusting Bollinger Bands parameters, it realizes optimization for both long and short positions to profit in both uptrend and downtrend markets.
Trading Logic
The core logic of this strategy is based on Bollinger Bands channel, which consists of middle line, upper band and lower band. The middle line is the moving average of closing price for n days. The upper and lower bands are deviations above and below the middle line. When price approaches the upper band, it indicates the market may be overheated and there can be short opportunities. When price approaches the lower band, it indicates the market may be undervalued and there can be long opportunities.
This strategy uses two Bollinger Bands. Bollinger Band 1 is suitable for long trades and Bollinger Band 2 is suitable for short trades. The parameters of Bollinger Band 1 are optimized with length of 25 and deviation of 2.9 times. The parameters of Bollinger Band 2 are optimized with length of 36 and deviation of 3.2 times. When closing price crosses above the lower band of Bollinger Band 1, it will generate long signal. When closing price crosses below the upper band of Bollinger Band 2, it will generate short signal.
Advantage Analysis
Compared with traditional Bollinger Bands strategies, this strategy has the following advantages:
-
It realizes dual-directional trading for both long and short sides, which can seize trading opportunities in different market stages.
-
The parameters are optimized. The two sets of Bollinger Bands parameters are elaborately tested to effectively generate trading signals.
-
The risk is controllable. The moving stop loss method can effectively control the risk of one side.
Risk Analysis
There are also some potential risks for this strategy:
-
Invalidity risk of Bollinger Bands. Bollinger Bands may become invalid during extreme market fluctuation.
-
Risk of stop loss being hit. Moving stop loss could be hit to expand losses. We can properly widen the stop loss or timely stop out to avoid this risk.
-
High trading frequency risk. Overly sensitive parameters could lead to frequent trading and increased trading costs.
Optimization Directions
There is still room for further optimization of this strategy:
-
Combine other indicators to filter signals and avoid wrong trades when Bollinger Bands fails. Such as K-line patterns, trading volume etc.
-
Dynamically adjust parameters to fit the market characteristics of different periods. For example, use adaptive Bollinger Bands.
-
Optimize the stop loss methods by using trailing stop loss or exponential moving stop loss to effectively control risks.
-
Combine machine learning algorithms to automatically optimize the parameters.
Summary
In summary, this strategy overall optimizes dual-directional trading for both long and short sides based on double Bollinger Bands channel and parameters optimization. Compared with traditional Bollinger Bands strategies, it has the advantages of dual-directional trading and risk control. It is suitable to seize opportunities in different market stages and has certain practical value. But risks like failure of Bollinger Bands and stop loss being hit still exist. Further optimization and verification are needed before productization.
- 1