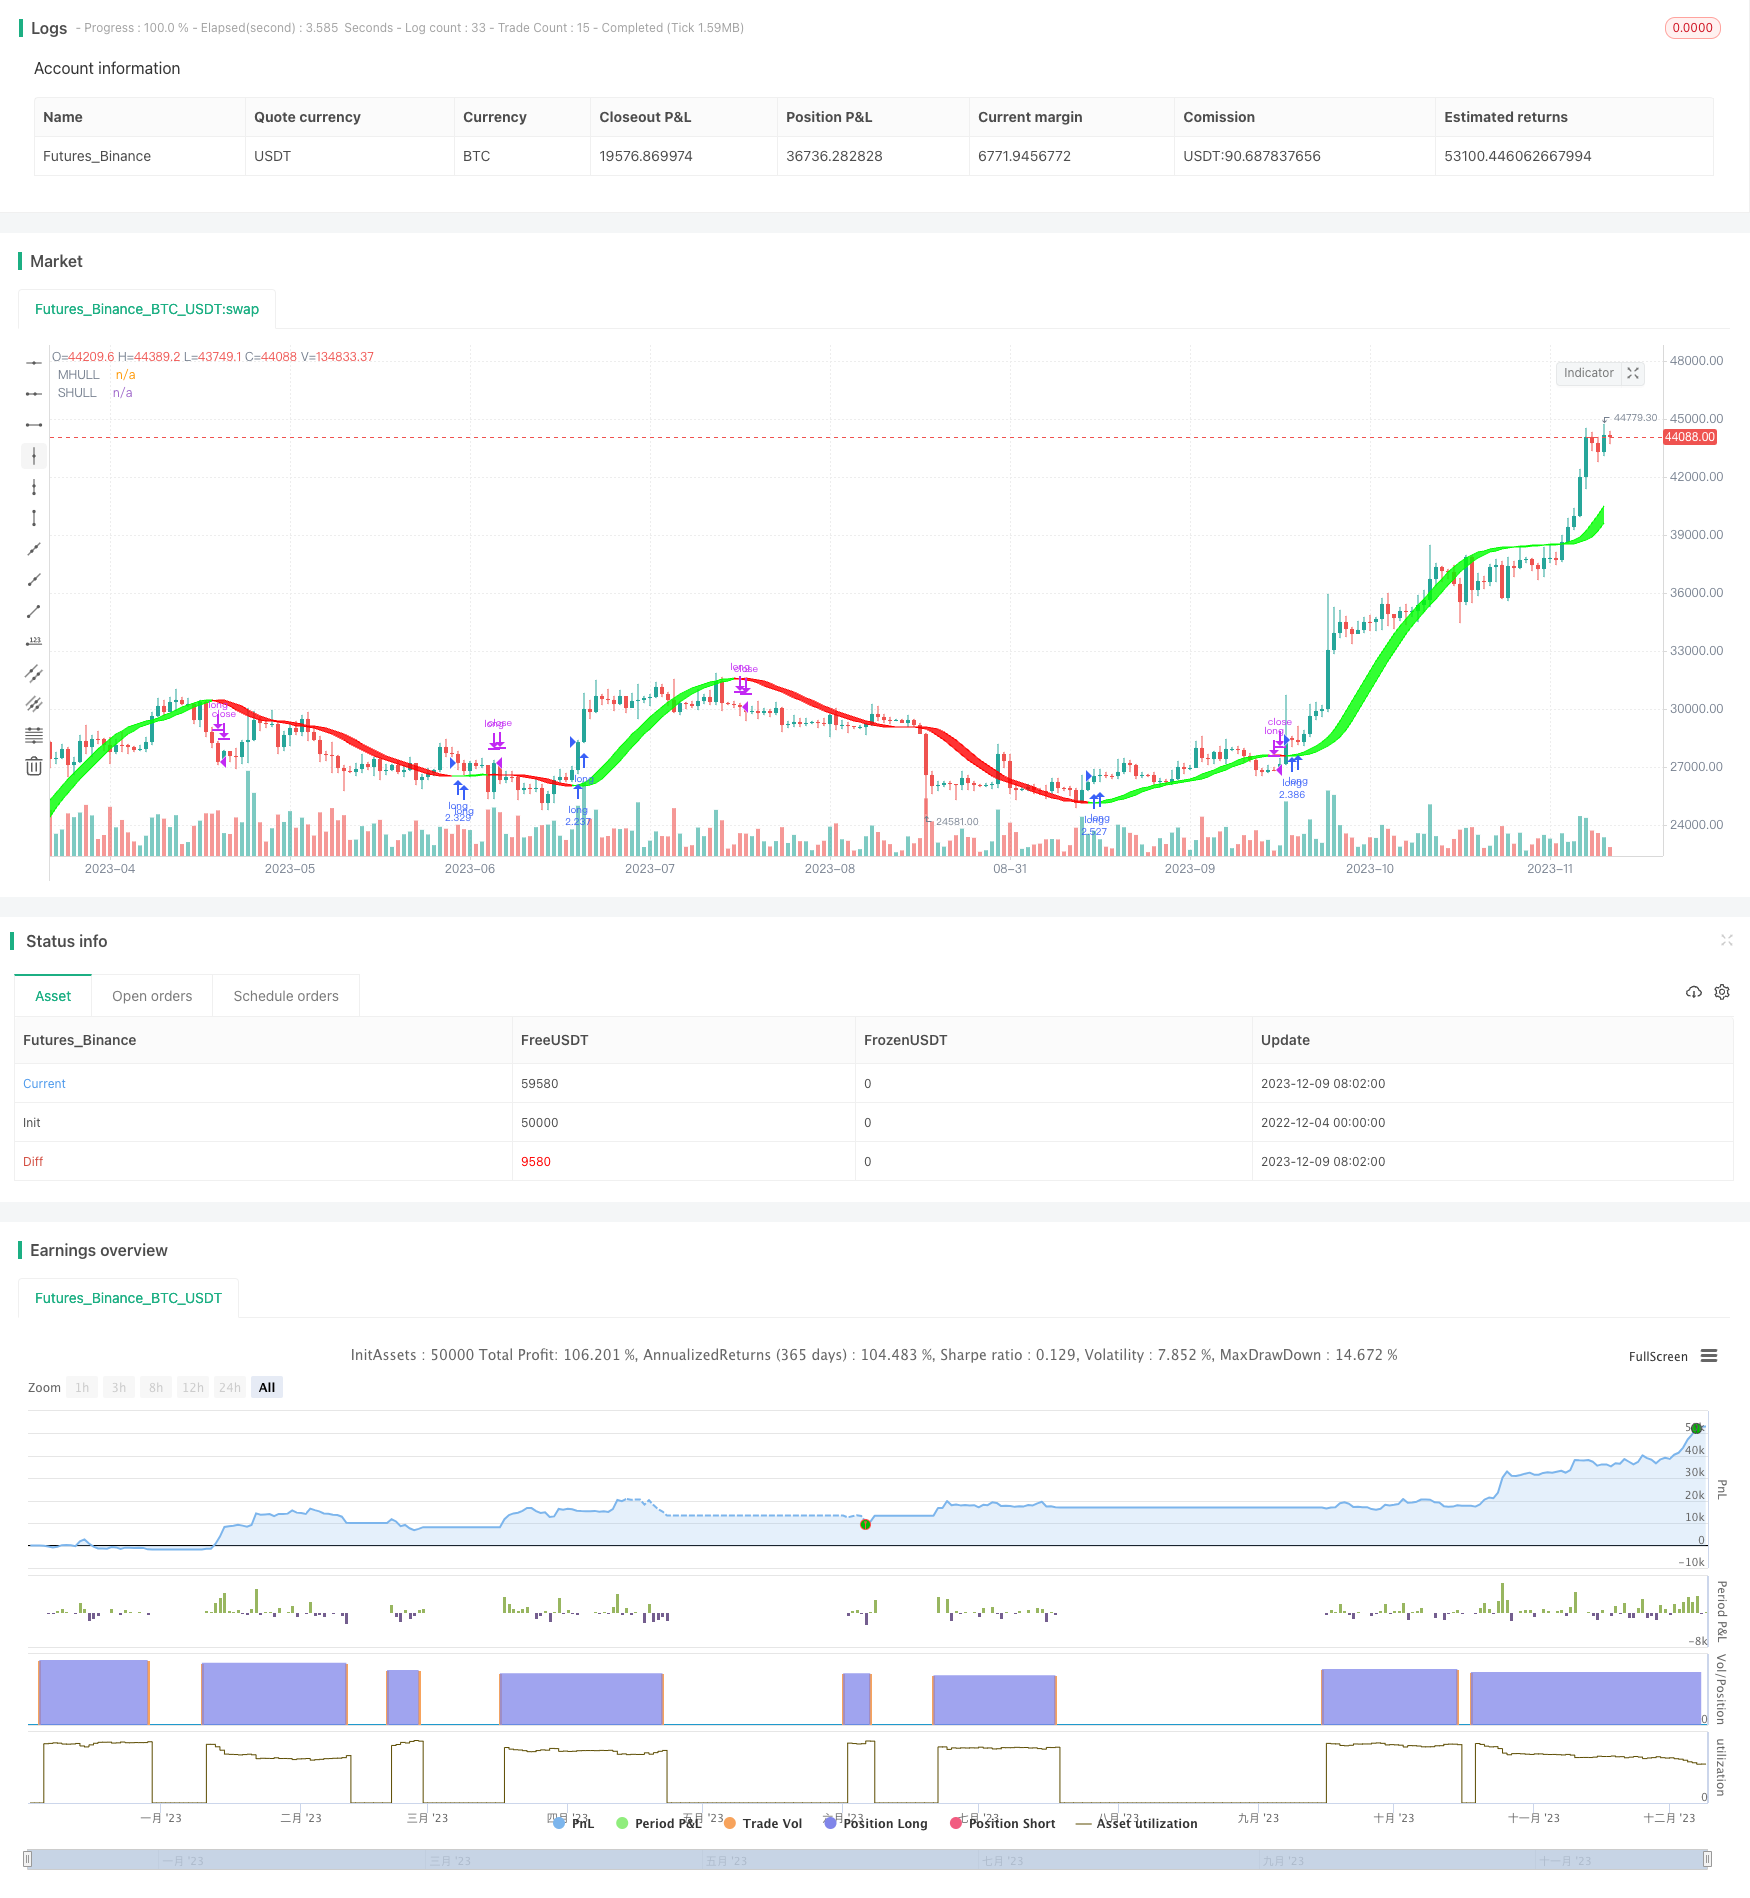
概述
双向霍尔移动平均线交易策略是一种利用双向霍尔移动平均线作为交易信号的量化交易策略。该策略借鉴了传统技术分析中使用单一移动平均线的方法,改用双向霍尔移动平均线,在突破点进行买入和卖出。
策略原理
双向霍尔移动平均线交易策略的核心是双向霍尔移动平均线(Dual Hull Moving Average)。双向霍尔移动平均线由中轨、上轨和下轨三条线组成,代表不同的价格平均值。其计算公式为:
中轨:Mode(modeSwitch, src, len) 上轨:HULL[0] 下轨:HULL[2]
这里的Mode函数可以选择Hull移动平均线的不同变种,包括HMA、EHMA和THMA。src代表价格源,len代表周期长度。
该策略以双向霍尔移动平均线的中轨为基准,判断价格与中轨的关系,制定交易信号:
- 当价格上穿中轨时,做多
- 当价格下穿中轨时,平仓
也就是说,如果当前K线的收盘价大于中轨的值,则在下一根K线开盘时做多;如果当前K线的收盘价小于中轨的值,则在下一根K线开盘时平仓。
优势分析
双向霍尔移动平均线交易策略具有以下优势:
使用双向带状区域而不是单一均线,有更好的支持和阻力效应,也更有利于跟踪趋势。
相比一般移动平均线,Hull移动平均线有更低的滞后性,可以更快速地响应价格变动。
借鉴传统技术分析方法,容易理解,适合用于自动化交易。
策略逻辑简单清晰,容易实现,适合高频算法交易。
可自定义Hull移动平均类型和参数,可以针对不同品种和交易时间框架进行优化。
风险分析
尽管双向霍尔移动平均线交易策略有许多优势,但也存在一些风险需要注意:
当价格震荡时,可能出现较多止损。可以适当调整参数,过滤部分噪声交易。
该策略主要基于趋势跟随,在价格横盘时效果不佳。可以加入其他指标或机制来判断趋势。
Hull移动平均线本身也存在滞后性,特别是在短期内。 Parameter优化和组合指标可以部分解决。
交易信号频繁,容易过度交易。适当控制仓位管理和交易频率。
优化方向
双向霍尔移动平均线交易策略还有以下几个主要的优化方向:
优化Hull移动平均线的类型和参数,调整中轨的灵敏度,适应不同交易品种。
加入止损机制。trailing stop或增量止损,有效控制单笔损失。
结合其他指标,判断趋势方向和力度,避免被套。例如MACD,KD等。
加入基于交易次数或收益率的策略激活条件。控制闭合循环次数,减少平仓。
多时间框架结合。利用更高时间框架确定趋势方向,避免被噪声误导。
优化出入场逻辑。可基于candle形态,增加入场确定性。
总结
双向霍尔移动平均线交易策略整体来说是一种利用趋势指数型移动平均线构建交易信号的量化策略。相比传统移动平均线,其响应更迅速,跟踪效果更好。该策略逻辑简单清晰,容易实现,适合自动化交易。当然也存在一些噪声风险和趋势跟随缺陷。通过参数优化,止损机制,以及组合其他指标等手段,可以强化该策略在实盘中的表现。
/*backtest
start: 2022-12-04 00:00:00
end: 2023-12-10 00:00:00
period: 1d
basePeriod: 1h
exchanges: [{"eid":"Futures_Binance","currency":"BTC_USDT"}]
*/

//@version=4
//Basic Hull Ma Pack tinkered by InSilico
//Converted to Strategy by DashTrader
strategy("Hull Suite Strategy", overlay=true, pyramiding=1, default_qty_type= strategy.percent_of_equity, default_qty_value = 100, calc_on_order_fills=false, slippage=0,commission_type=strategy.commission.percent,commission_value=0)
//////////////////////////////////////////////////////////////////////
// Testing Start dates
testStartYear = input(2016, "Backtest Start Year")
testStartMonth = input(1, "Backtest Start Month")
testStartDay = input(1, "Backtest Start Day")
testPeriodStart = timestamp(testStartYear,testStartMonth,testStartDay,0,0)
//Stop date if you want to use a specific range of dates
testStopYear = input(2030, "Backtest Stop Year")
testStopMonth = input(12, "Backtest Stop Month")
testStopDay = input(30, "Backtest Stop Day")
testPeriodStop = timestamp(testStopYear,testStopMonth,testStopDay,0,0)


testPeriod() =>
    time >= testPeriodStart and time <= testPeriodStop ? true : false
// Component Code Stop
//////////////////////////////////////////////////////////////////////
//INPUT
HAClose = security(heikinashi(syminfo.tickerid), timeframe.period, close)
src = input(close, title="Source")
modeSwitch = input("Hma", title="Hull Variation", options=["Hma", "Thma", "Ehma"])
length = input(55, title="Length(180-200 for floating S/R , 55 for swing entry)")
switchColor = input(true, "Color Hull according to trend?")
candleCol = input(false,title="Color candles based on Hull's Trend?")
visualSwitch  = input(true, title="Show as a Band?")
thicknesSwitch = input(1, title="Line Thickness")
transpSwitch = input(40, title="Band Transparency",step=5)

//FUNCTIONS
//HMA
HMA(_src, _length) =>  wma(2 * wma(_src, _length / 2) - wma(_src, _length), round(sqrt(_length)))
//EHMA
EHMA(_src, _length) =>  ema(2 * ema(_src, _length / 2) - ema(_src, _length), round(sqrt(_length)))
//THMA
THMA(_src, _length) =>  wma(wma(_src,_length / 3) * 3 - wma(_src, _length / 2) - wma(_src, _length), _length)

//SWITCH
Mode(modeSwitch, src, len) =>
      modeSwitch == "Hma"  ? HMA(src, len) :
      modeSwitch == "Ehma" ? EHMA(src, len) :
      modeSwitch == "Thma" ? THMA(src, len/2) : na

//OUT
HULL = Mode(modeSwitch, src, length)
MHULL = HULL[0]
SHULL = HULL[2]

//COLOR
hullColor = switchColor ? (HULL > HULL[2] ? #00ff00 : #ff0000) : #ff9800

//PLOT
///< Frame
Fi1 = plot(MHULL, title="MHULL", color=hullColor, linewidth=thicknesSwitch, transp=50)
Fi2 = plot(visualSwitch ? SHULL : na, title="SHULL", color=hullColor, linewidth=thicknesSwitch, transp=50)
///< Ending Filler
fill(Fi1, Fi2, title="Band Filler", color=hullColor, transp=transpSwitch)
///BARCOLOR
barcolor(color = candleCol ? (switchColor ? hullColor : na) : na)


if HULL[0] > HULL[2] and testPeriod()
    strategy.entry("long", strategy.long)
if HULL[0] < HULL[2] and testPeriod()
    strategy.close("long")