MACD Stochastics Range Breakout Strategy

Overview
The MACD Stochastics Range Breakout Strategy combines the MACD and Stochastics indicators into a quantitative trading strategy. It attempts to identify the trend direction of stock prices and take positions when prices break out of ranging zones.
When taking positions, this strategy considers the signals from both MACD and Stochastics to improve the quality of entries. Also, preset stop loss and take profit points can effectively control risks.
Strategy Logic
The MACD Stochastics Range Breakout Strategy is mainly based on the following principles:
- MACD indicator can effectively identify the direction and momentum of price trends
- Stochastics indicator can spot overbought or oversold conditions of a stock
- When stock price has been ranging for a period of time, a significant directional move after breaking previous range is likely to happen
- Combining the signals from MACD and Stochastics on range breakouts allows timely entries and improves quality
Specifically, the strategy uses the MACDDIFF line crossing over DEA line to determine bullish or bearish trend signals. When DIFF crosses over DEA upwards, it generates a bullish signal and vice versa.
Meanwhile, crosses between Stochastics’s K line and D line around overbought/oversold areas (default 30 and 70) also produce trade signals.
When MACD and Stochastics give aligned signals, the strategy will take a position. At this point, a major price move is likely.
After entering, stop loss and take profit points are set to rationally control single trade loss and lock in profits.
Strengths
The MACD Stochastics Range Breakout Strategy has the following strengths:
-
Combining indicators improves signal quality
Utilizing both MACD and Stochastics filters out some fake signals and allows better entry quality.
-
Capturing breakout moves and trend trading
The strategy specializes in catching significant breakout moves after ranging. These moves tend to be huge.
-
Optimized stop loss/take profit mechanism effectively controls risks
Built-in stop loss/take profit logic reasonably limits single trade loss and timely locks in gains.
Risks
Despite careful design, MACD Stochastics Range Breakout Strategy has some inherent risks:
-
Missing perfect entry timing
False breakouts are common before valid breakouts happen. Suboptimal entry timing may result in missed best entry price.
-
Failed breakout
While adequate preparations are made prior to entries, failed breakouts are still possible, leading to losses.
-
Improper parameter optimization
Inappropriate parameter settings severely undermine strategy performance.
To address the above risks, the following optimizations can be adopted:
-
Adding other indicators to filter signals
-
Manual intervention to ensure valid breakout
-
Rigorous multi-set parameter optimization tests
Optimization Directions
There remains room for further optimization of the MACD Stochastics Range Breakout Strategy:
-
Optimize MACD parameters to find best combination
-
Optimize Stochastics parameters to find best combination
-
Incorporate other indicators like KDJ, BOLL to improve entry quality
-
Test different holding periods, optimize stop loss/take profit
-
Test cross-asset parameter differences
-
Introduce machine learning algorithms for automated parameter optimization
Conclusion
The MACD Stochastics Range Breakout Strategy capitalizes on range breakouts by entering based on aligned signals from both MACD and Stochastics. The stop loss/take profit mechanism further controls risks. It aims to capture short-term trends but still leaves room for parameter tuning and more indicator combinations for better performance.
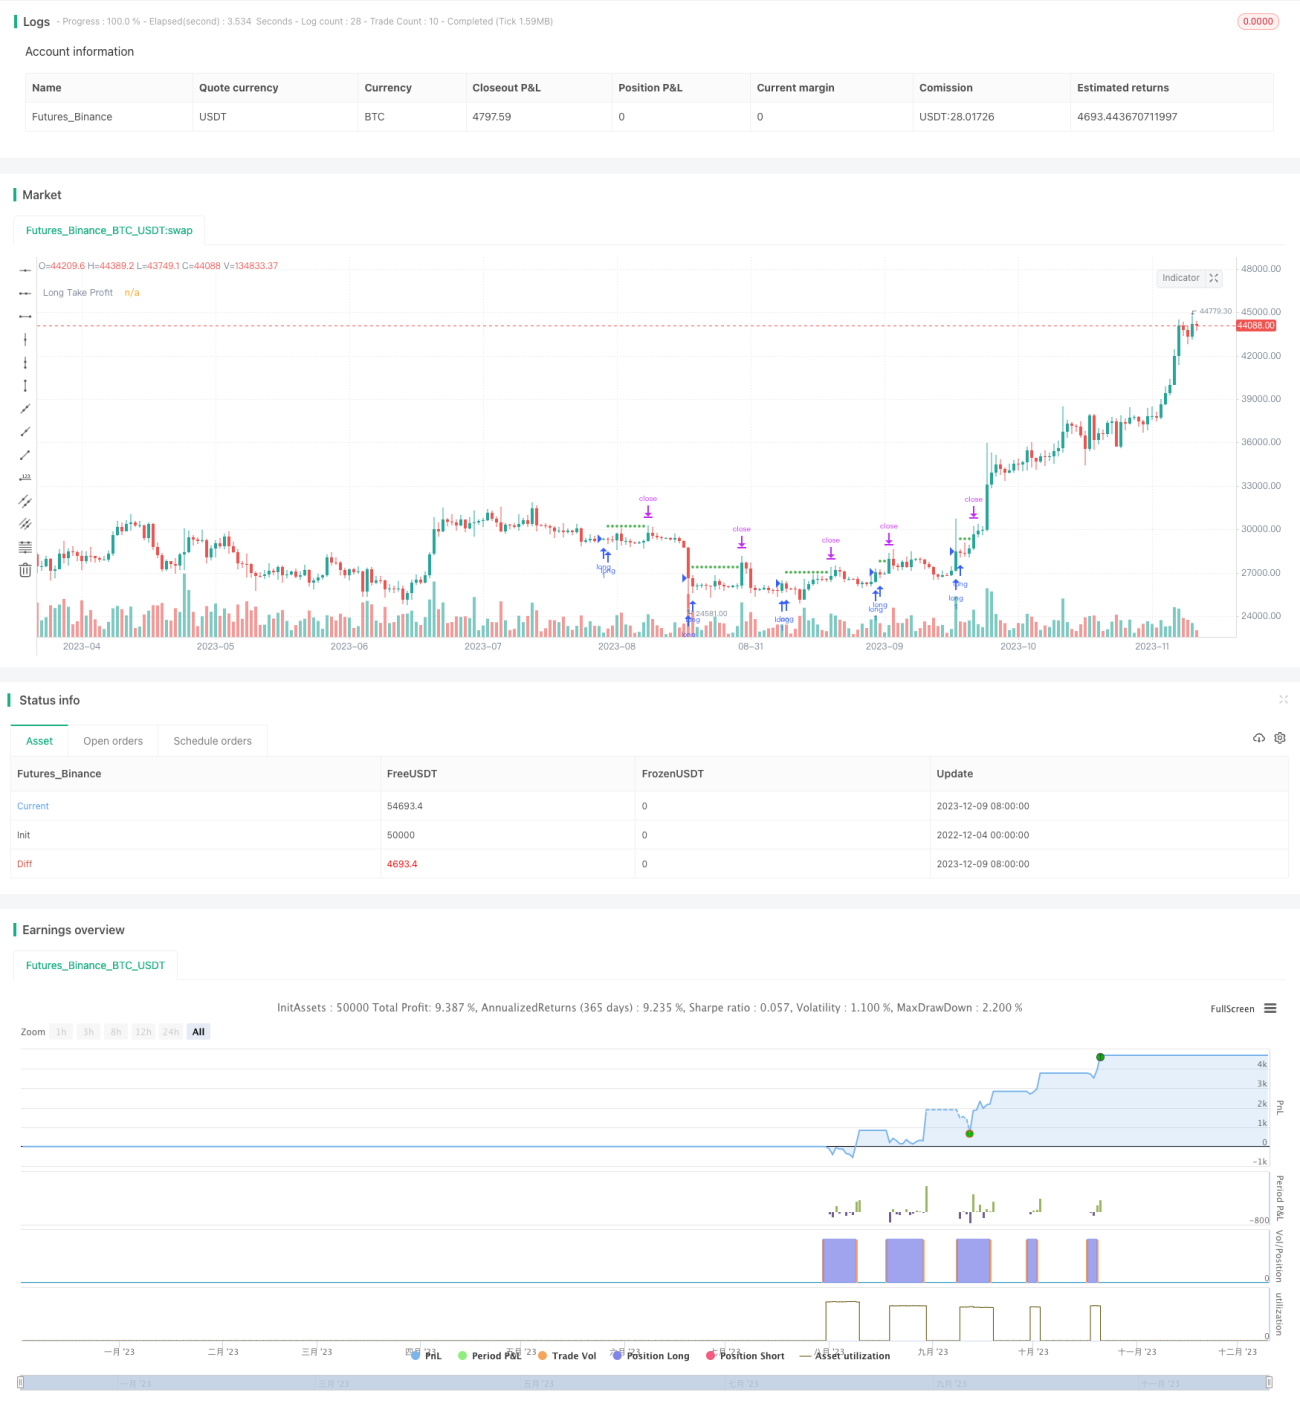
/*backtest
start: 2022-12-04 00:00:00
end: 2023-12-10 00:00:00
period: 1d
basePeriod: 1h
exchanges: [{"eid":"Futures_Binance","currency":"BTC_USDT"}]
*/

//@version=5
strategy(title="macd stoch strategy", shorttitle="benzo MACD stoch",overlay=true)
// Getting inputs
fast_length = input(title = "Fast Length", defval = 180)- 1