Derivative Based Trend Strategy

Author: ChaoZhang, Date: 2023-12-11 16:28:20
Tags:

img

Overview

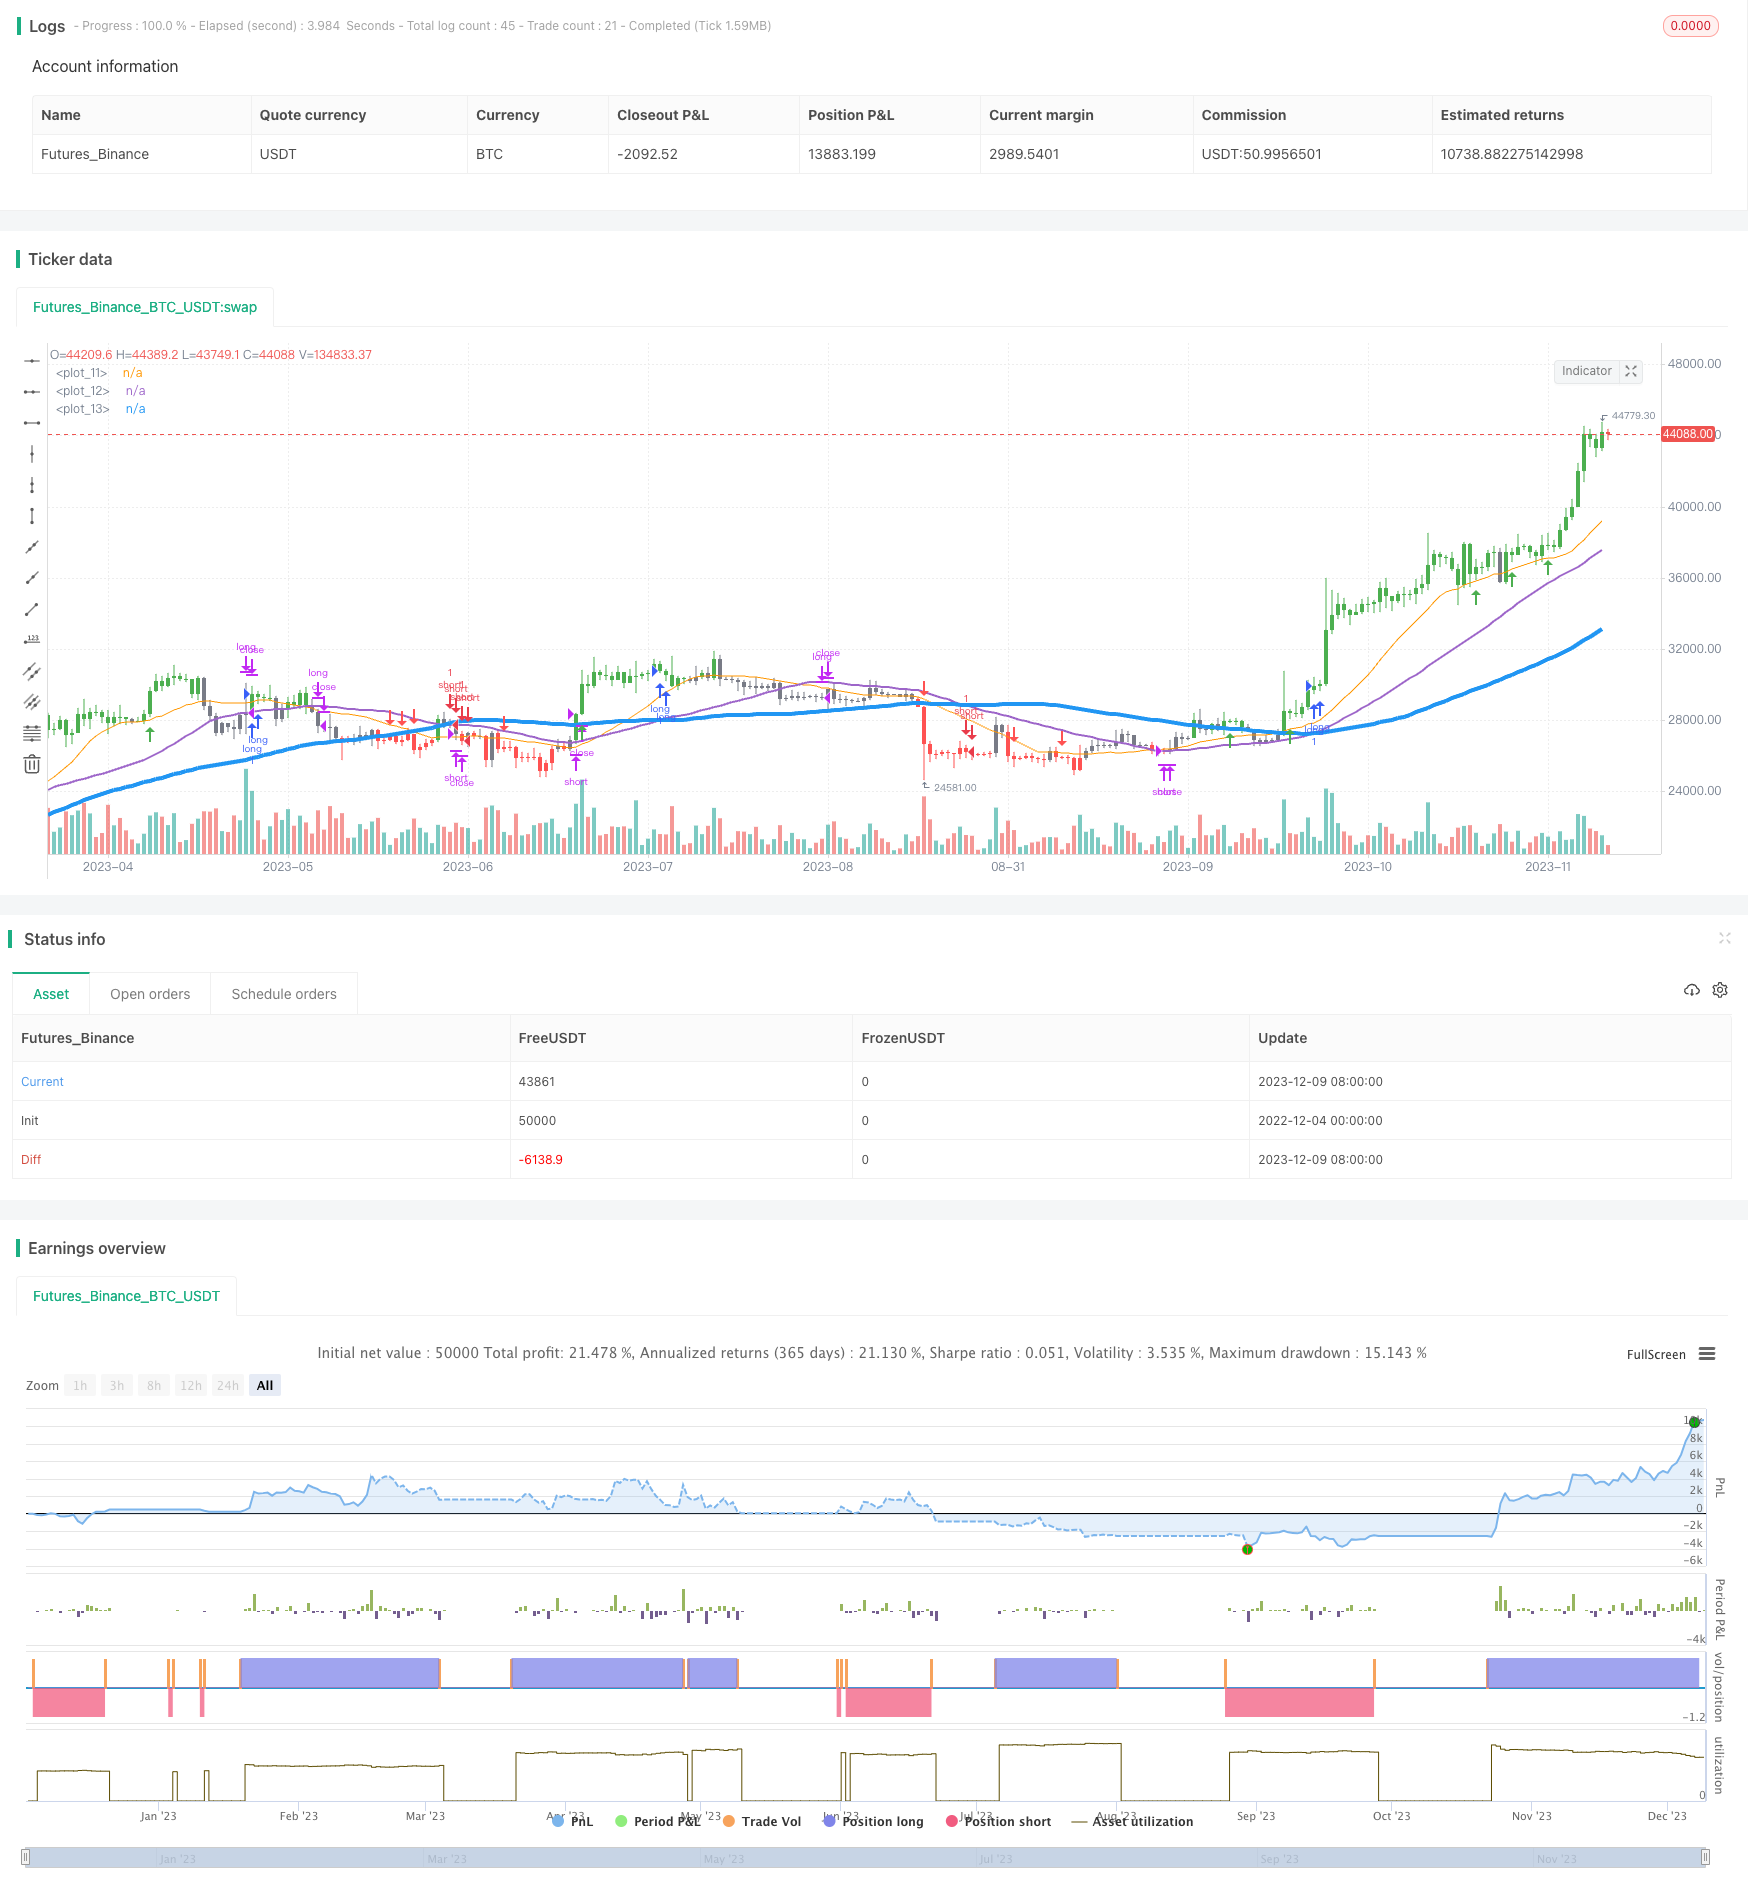
This strategy uses a combination of moving averages with different periods to establish trends and uses finite difference derivative approximations to predict possible reversals. It works best on hourly charts of less volatile currency pairs.

Strategy Logic

The strategy uses 20-, 40-, and 80-period simple moving averages simultaneously. When the closing price is above these 3 moving averages, it is defined as an uptrend; when the closing price is below these 3 moving averages, it is defined as a downtrend. The trend is confirmed only when the lowest price is above or the highest price is below these 3 moving averages.

To predict possible reversal points, the strategy uses the finite difference derivative approximation of the first derivative of the 40-period simple moving average. When the first derivative is positive, it indicates a stable uptrend; when the first derivative is negative, it indicates a stable downtrend.

The specific trading rules are:

  1. When the fast line is above the middle line and the middle line is above the slow line, and the first derivative > 0, go long;

  2. When the fast line is below the middle line and the middle line is below the slow line, and the first derivative <0, go short;

  3. Close long position when the first derivative <= 0;

  4. Close short position when the first derivative >= 0.

Advantage Analysis

The advantages of this strategy include:

  1. Using multiple moving averages to determine trends makes trend judgment more reliable;

  2. Predicting reversal points with derivatives allows timely stop loss and smaller drawdowns;

  3. The logic is simple and easy to understand, suitable for beginners;

  4. Only trading reversals after trends avoids being trapped and has a higher win rate.

Risk Analysis

There are also some risks with this strategy:

  1. The moving average combination may give wrong signals during range-bound markets;

  2. The derivative reversal signals may lag and cannot completely avoid losses;

  3. Improper stop loss setting may expand losses.

To address these risks, we can optimize the parameters of the moving averages, adjust the stop loss, combine with other indicators to improve the strategy.

Optimization Directions

The strategy can be optimized in the following aspects:

  1. Optimize the moving average periods to better suit different market conditions;

  2. Try different types of moving averages, like EMAs;

  3. Use volatility indicators to set dynamic stops;

  4. Combine other indicators for confirmation to avoid false signals.

Conclusion

This moving average combination trend strategy uses multiple moving averages to determine trend direction and derivatives to predict reversals, which can effectively control risks and is suitable for medium-term trading. The strategy is simple and easy to optimize, making it ideal for beginners to learn and practice trend following strategies. Further optimizations can make the parameters more adaptive to different products for better results.


/*backtest
start: 2022-12-04 00:00:00
end: 2023-12-10 00:00:00
period: 1d
basePeriod: 1h
exchanges: [{"eid":"Futures_Binance","currency":"BTC_USDT"}]
*/

//@version=3
strategy("Big 3",overlay=true, default_qty_type=strategy.percent_of_equity)
 
// enter on Arrows
// take profit on touch with 80 SMA, gray, or at discretion
 
fast = sma(close,20)
mid = sma(close,40)
slow = sma(close,80)
 
plot(fast,linewidth=1)
plot(mid,linewidth=2)
plot(slow,linewidth=4)
 
isUptrend = close > fast and close > mid and close > slow
isDowntrend = close < fast and close < mid and close < slow
 
confirmed = (low > fast and low > mid and low > slow) or (high < fast and high < mid and high < slow)
deriv = 3 * mid[0] - 4 * mid[1] + mid[2]

stableUptrend = (fast > mid) and (mid > slow) and (deriv > 0)
stableDowntrend = (fast < mid) and (mid < slow) and (deriv < 0)
 
barcolor(isUptrend ? green : isDowntrend ? red : gray)
plotshape(not confirmed[1] and confirmed and isUptrend ? close : na,style=shape.arrowup,location=location.belowbar,color=green)
plotshape(not confirmed[1] and confirmed and isDowntrend ? close : na,style=shape.arrowdown,location=location.abovebar,color=red)

stop = na
//stop = input(1000, "Stop")


strategy.entry("long", strategy.long, when=(stableUptrend), stop=stop)
strategy.close("long", when=(deriv <= 0))

strategy.entry("short", strategy.short, when=(stableDowntrend), stop=stop)
strategy.close("short", when=(deriv >= 0))


More