Moving Average Crossover Strategy for Two-way Trading

Author: ChaoZhang, Date: 2023-12-12 11:26:54
Tags:

img

Overview

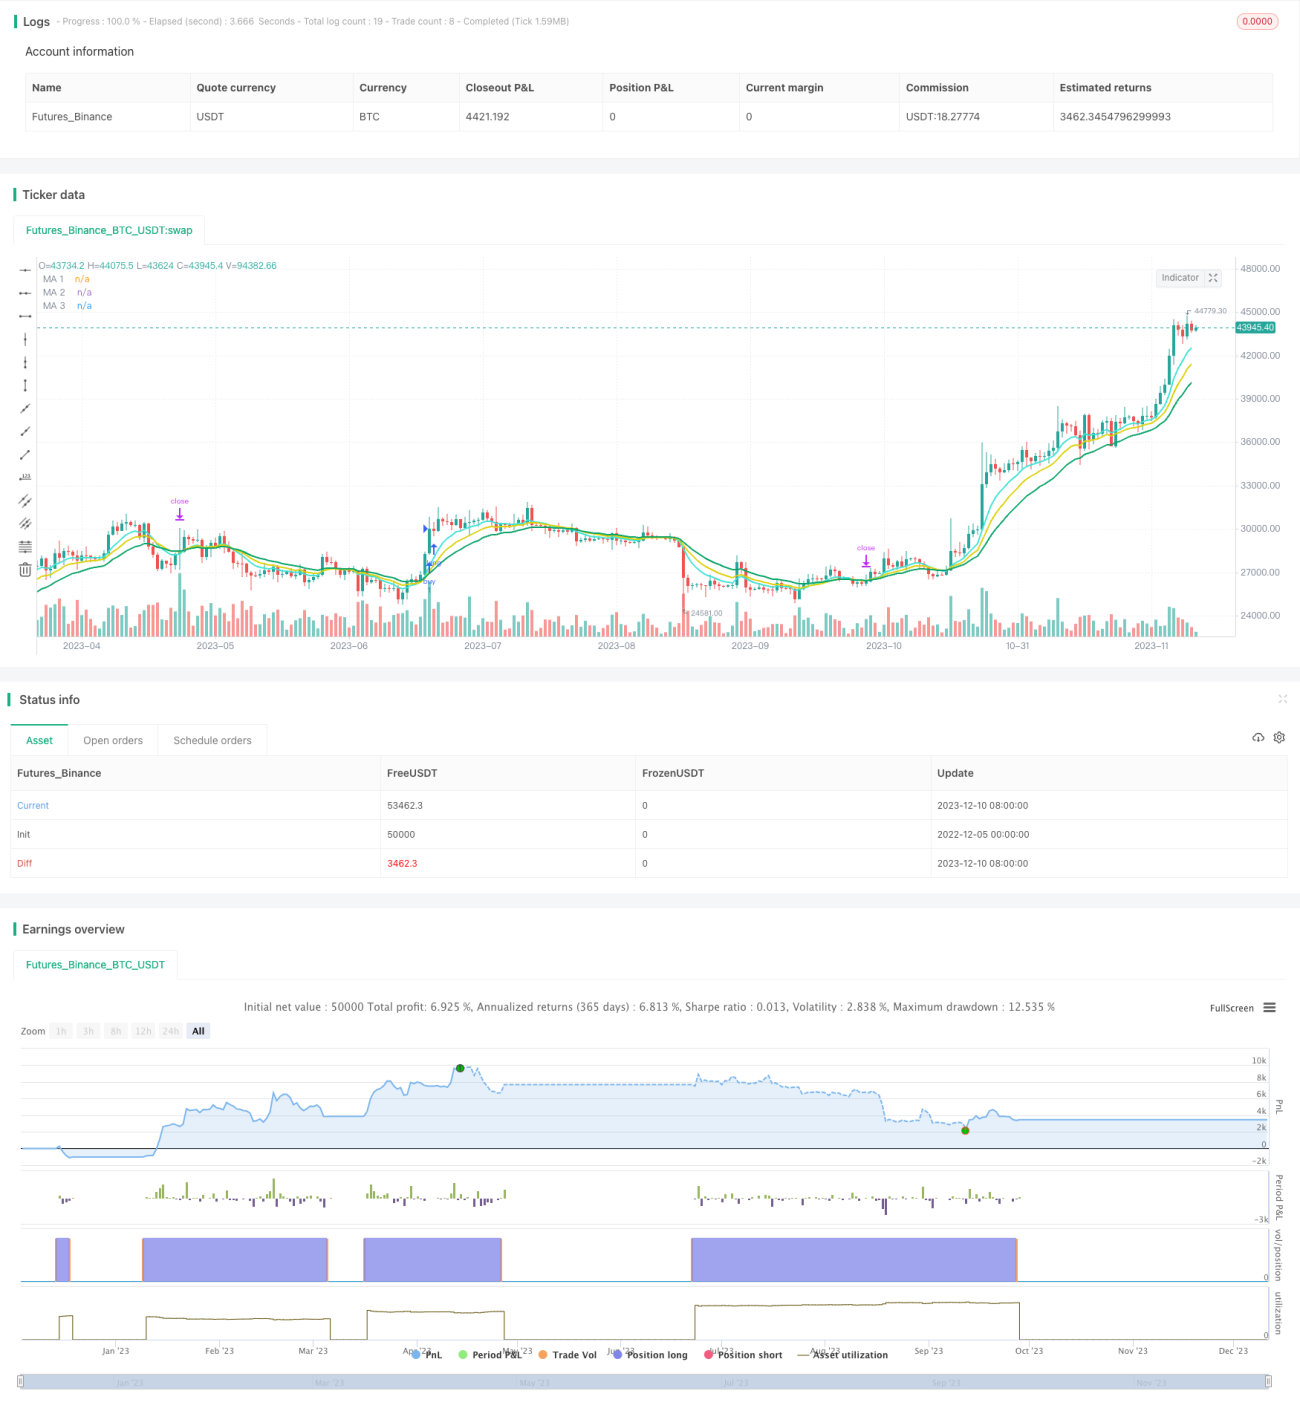
This strategy calculates moving averages of different periods and issues trading signals when the shorter period moving average crosses over or crosses below the longer period moving average. It belongs to the typical moving average crossover system. The strategy supports both long and short positions to achieve two-way trading.

Principles

The strategy judges market trends and generates trading signals based on the crossover between moving averages of different periods. It uses three moving average lines of 8-period, 13-period and 21-period, where the 8-period line is the shorter period line and the 21-period line is the longer period line. A long signal is triggered when the 8-period line crosses over the 21-period line. A short signal is triggered when the 8-period line crosses below the 21-period line.

In actual trading execution, the strategy also includes a filtering condition to avoid being trapped in choppy markets. It only places orders when the closing price is higher (long signal) or lower (short signal) than the crossover point. This can effectively filter out some false signals.

Advantages

  1. Applies moving average crossover rules to effectively track market trends
  2. Adds trade filters to avoid some false signals and being trapped
  3. Supports two-way trading to profit in both bull and bear markets
  4. Captures turns between major levels using inter-period moving averages
  5. Simple and clear logic, easy to understand and optimize

Risks

  1. May fail or generate excessive false signals in highly volatile markets
  2. Unable to judge when prices move sideways, missing opportunities
  3. Inter-period crossover has a lag, may not timely capture short-term trend changes
  4. Does not consider price volatility, parameters need adjustments for different volatility levels
  5. No stop loss or take profit, risks unlimited losses

Solutions for Risks

  1. Combine other indicators to judge markets, avoid volatility impact
  2. Lower moving average periods for higher sensitivity
  3. Add stop loss and take profit to control risks and drawdowns

Optimization Directions

  1. Combine other indicators like MACD and KDJ to improve efficacy
  2. Test impacts of different parameter settings on overall strategy performance
  3. Set adaptive parameters based on market type and volatility levels
  4. Optimize moving average calculation methods using DEMA, ZLEMA etc.
  5. Add stop loss and take profit logic
  6. Optimize quant backtesting metrics to determine best parameters

Conclusion

The strategy has a clear logic of using simple moving average crossover to determine relationships between short-term and long-term trends and capture rotation opportunities. It supports two-way trading and is easy to understand and optimize. But some risks exist like ineffective handling of specific market conditions and lack of risk control. Subsequent technical indicator combos and parameter optimization can further improve strategy stability and profitability.


/*backtest
start: 2022-12-05 00:00:00
end: 2023-12-11 00:00:00
period: 1d
basePeriod: 1h
exchanges: [{"eid":"Futures_Binance","currency":"BTC_USDT"}]
*/

//@version=3
//Converted to strategy by shawnteoh

strategy(title = "MA Emperor insiliconot Strategy" , overlay=true, pyramiding=1, precision=8)
strat_dir_input = input(title="Strategy Direction", defval="long", options=["long", "short", "all"])
strat_dir_value = strat_dir_input == "long" ? strategy.direction.long : strat_dir_input == "short" ? strategy.direction.short : strategy.direction.all
strategy.risk.allow_entry_in(strat_dir_value)

// Testing start dates
testStartYear = input(2020, "Backtest Start Year")
testStartMonth = input(1, "Backtest Start Month")
testStartDay = input(1, "Backtest Start Day")
testPeriodStart = timestamp(testStartYear,testStartMonth,testStartDay,0,0)
//Stop date if you want to use a specific range of dates
testStopYear = input(2030, "Backtest Stop Year")
testStopMonth = input(12, "Backtest Stop Month")
testStopDay = input(30, "Backtest Stop Day")
testPeriodStop = timestamp(testStopYear,testStopMonth,testStopDay,0,0)
// Order size
orderQty = input(1, "Order quantity", type = float)
// Plot indicator
plotInd = input(false, "Plot indicators?", type = bool)

testPeriod() =>
    time >= testPeriodStart and time <= testPeriodStop ? true : false

haClose = close
haOpen  = open
haHigh  = high
haLow   = low 

haClose := (open + high + low + close) / 4
haOpen  := (nz(haOpen[1]) + nz(haClose[1])) / 2
haHigh  := max(high, max(haOpen, haClose))
haLow   := min(low , min(haOpen, haClose))

ssrc = close
ha = false

o = ha ? haOpen : open
c = ha ? haClose : close
h = ha ? haHigh : high
l = ha ? haLow : low

ssrc := ssrc == close ? ha ? haClose : c : ssrc
ssrc := ssrc == open ? ha ? haOpen : o : ssrc
ssrc := ssrc == high ? ha ? haHigh : h : ssrc
ssrc := ssrc == low ? ha ? haLow : l : ssrc
ssrc := ssrc == hl2 ? ha ? (haHigh + haLow) / 2 : hl2 : ssrc
ssrc := ssrc == hlc3 ? ha ? (haHigh + haLow + haClose) / 3 : hlc3 : ssrc
ssrc := ssrc == ohlc4 ? ha ? (haHigh + haLow + haClose+ haOpen) / 4 : ohlc4 : ssrc

type = input(defval = "EMA", title = "Type", options = ["Butterworth_2Pole", "DEMA", "EMA", "Gaussian", "Geometric_Mean", "LowPass", "McGuinley", "SMA", "Sine_WMA", "Smoothed_MA", "Super_Smoother",  "Triangular_MA", "Wilders", "Zero_Lag"])

len1=input(8, title ="MA 1")
len2=input(13, title = "MA 2") 
len3=input(21, title = "MA 3")
len4=input(55, title = "MA 4")
len5=input(89, title = "MA 5")
lenrib=input(120, title = "IB")
lenrib2=input(121, title = "2B")
lenrib3=input(200, title = "21b")
lenrib4=input(221, title = "22b")

onOff1  = input(defval=true, title="Enable 1")
onOff2  = input(defval=true, title="Enable 2")
onOff3  = input(defval=true, title="Enable 3")
onOff4  = input(defval=false, title="Enable 4")
onOff5  = input(defval=false, title="Enable 5")
onOff6  = input(defval=false, title="Enable 6")
onOff7  = input(defval=false, title="Enable 7")
onOff8  = input(defval=false, title="Enable x")
onOff9  = input(defval=false, title="Enable x")


gauss_poles = input(3, "*** Gaussian poles ***",  minval = 1, maxval = 14) 
linew = 2
shapes = false

 
variant_supersmoother(src,len) =>
    Pi = 2 * asin(1)
    a1 = exp(-1.414* Pi / len)
    b1 = 2*a1*cos(1.414* Pi / len)
    c2 = b1
    c3 = (-a1)*a1
    c1 = 1 - c2 - c3
    v9 = 0.0
    v9 := c1*(src + nz(src[1])) / 2 + c2*nz(v9[1]) + c3*nz(v9[2])
    v9
    
variant_smoothed(src,len) =>
    v5 = 0.0
    v5 := na(v5[1]) ? sma(src, len) : (v5[1] * (len - 1) + src) / len
    v5

variant_zerolagema(src, len) =>
    price = src
    l = (len - 1) / 2
    d = (price + (price - price[l]))
    z = ema(d, len)
    z
    
variant_doubleema(src,len) =>
    v2 = ema(src, len)
    v6 = 2 * v2 - ema(v2, len)
    v6

variant_WiMA(src, length) =>
    MA_s= nz(src)
    MA_s:=(src + nz(MA_s[1] * (length-1)))/length
    MA_s
    
fact(num)=>
    a = 1
    nn = num <= 1 ? 1 : num
    for i = 1 to nn
        a := a * i
    a
    
getPoles(f, Poles, alfa)=>
    filt = f
    sign = 1
    results = 0 + n//tv series spoofing
    for r = 1 to max(min(Poles, n),1)
	    mult  = fact(Poles) / (fact(Poles - r) * fact(r))
	    matPo = pow(1 - alfa, r)
        prev  = nz(filt[r-1],0)
        sum   =  sign * mult * matPo * prev
        results := results + sum
        sign  := sign * -1
    results := results - n
    results
    
variant_gauss(Price, Lag, Poles)=>
    Pi = 2 * asin(1)
    beta = (1 - cos(2 * Pi / Lag)) / ( pow (sqrt(2), 2.0 / Poles) - 1)
    alfa = -beta + sqrt(beta * beta +  2 * beta)
    pre = nz(Price, 0) * pow(alfa, Poles) 
    filter = pre
    result = n > 0 ?  getPoles(nz(filter[1]), Poles, alfa) : 0
    filter := pre + result

variant_mg(src, len)=>
    mg = 0.0
    mg := na(mg[1]) ? ema(src, len) : mg[1] + (src - mg[1]) / (len * pow(src/mg[1], 4))
    mg
    
variant_sinewma(src, length) =>
    PI = 2 * asin(1)
    sum = 0.0
    weightSum = 0.0
    for i = 0 to length - 1
        weight = sin(i * PI / (length + 1))
        sum := sum + nz(src[i]) * weight
        weightSum := weightSum + weight
    sinewma = sum / weightSum
    sinewma
    
variant_geoMean(price, per)=>
    gmean = pow(price, 1.0/per)
    gx = for i = 1 to per-1
        gmean := gmean * pow(price[i], 1.0/per)
        gmean
    ggx = n > per? gx : price    
    ggx


variant_butt2pole(pr, p1)=>
    Pi = 2 * asin(1)
    DTR = Pi / 180    
    a1 = exp(-sqrt(2) * Pi / p1)
    b1 = 2 * a1 * cos(DTR * (sqrt(2) * 180 / p1))
    cf1 = (1 - b1 + a1 * a1) / 4
    cf2 = b1
    cf3 = -a1 * a1
    butt_filt = pr
    butt_filt := cf1 * (pr + 2 * nz(pr[1]) + nz(pr[2])) + cf2 * nz(butt_filt[1]) + cf3 * nz(butt_filt[2])

variant_lowPass(src, len)=>
    LP = src
    sr = src
    a = 2.0 / (1.0 + len)
    LP := (a - 0.25 * a * a) * sr + 0.5 * a * a * nz(sr[1]) - (a - 0.75 * a * a) * nz(sr[2]) + 2.0 * (1.0 - a) * nz(LP[1]) - (1.0 - a) * (1.0 - a) * nz(LP[2])
    LP


variant_sma(src, len) =>
    sum = 0.0
    for i = 0 to len - 1
        sum := sum + src[i] / len
    sum

variant_trima(src, length) =>
    len = ceil((length + 1) * 0.5)
    trima =  sum(sma(src, len), len)/len
    trima


variant(type, src, len) =>
      type=="EMA"   ? ema(src, len) : 
      type=="LowPass" ? variant_lowPass(src, len) :  
      type=="Linreg"  ? linreg(src, len, 0) : 
      type=="Gaussian"  ? variant_gauss(src, len, gauss_poles) :
      type=="Sine_WMA"  ? variant_sinewma(src, len) :
      
      type=="Geometric_Mean"  ? variant_geoMean(src, len) :
      
      type=="Butterworth_2Pole" ? variant_butt2pole(src, len) : 
      type=="Smoothed_MA"  ? variant_smoothed(src, len) :
      type=="Triangular_MA"  ? variant_trima(src, len) : 
      type=="McGuinley" ? variant_mg(src, len) : 
      type=="DEMA"  ? variant_doubleema(src, len):  
      type=="Super_Smoother"  ? variant_supersmoother(src, len) : 
      type=="Zero_Lag"  ? variant_zerolagema(src, len) :  
      type=="Wilders"? variant_WiMA(src, len) : variant_sma(src, len)


c1=#44E2D6
c2=#DDD10D
c3=#0AA368
c4=#E0670E
c5=#AB40B2

cRed = #F93A00


ma1 =  variant(type, ssrc, len1)
ma2 =  variant(type, ssrc, len2)
ma3 =  variant(type, ssrc, len3)
ma4 =  variant(type, ssrc, len4)
ma5 =  variant(type, ssrc, len5)
ma6 =  variant(type, ssrc, lenrib)
ma7 =  variant(type, ssrc, lenrib2)
ma8 =  variant(type, ssrc, lenrib3)
ma9 =  variant(type, ssrc, lenrib4)

col1 = c1
col2 = c2
col3 = c3
col4 = c4
col5 = c5

p1 = plot(onOff1 ? ma1 : na, title = "MA 1",  color = col1,  linewidth = linew, style = linebr)
p2 = plot(onOff2 ? ma2 : na, title = "MA 2",  color = col2,  linewidth = linew, style = linebr)
p3 = plot(onOff3 ? ma3 : na, title = "MA 3",  color = col3,  linewidth = linew, style = linebr)
p4 = plot(onOff4 ? ma4 : na, title = "MA 4",  color = col4,  linewidth = linew, style = linebr)
p5 = plot(onOff5 ? ma5 : na, title = "MA 5",  color = col5,  linewidth = linew, style = linebr)
p6 = plot(onOff6 ? ma6 : na, title = "MA 6",  color = col5,  linewidth = linew, style = linebr)
p7 = plot(onOff7 ? ma7 : na, title = "MA 7",  color = col5,  linewidth = linew, style = linebr)
p8 = plot(onOff8 ? ma8 : na, title = "MA 8",  color = col5,  linewidth = linew, style = linebr)
p9 = plot(onOff9 ? ma9 : na, title = "MA 9",  color = col5,  linewidth = linew, style = linebr)

longCond = crossover(ma2, ma3)
if longCond and testPeriod()
    strategy.entry("buy", strategy.long, qty = orderQty, when = open > ma2[1])

shortCond = crossunder(ma2, ma3)
if shortCond and testPeriod()
    strategy.entry("sell", strategy.short, qty = orderQty, when = open < ma2[1])

plotshape(series=plotInd? longCond : na, title="P", style=shape.triangleup, location=location.belowbar, color=green, text="P", size=size.small)   
plotshape(series=plotInd? shortCond : na, title="N", style=shape.triangledown, location=location.abovebar, color=red, text="N", size=size.small)


More