RSI and Bollinger Bands Dual Strategy

Overview
The core idea of this strategy is to combine the Relative Strength Index (RSI) and Bollinger Bands, two technical indicators, to filter dual trading signals and minimize interference from false signals as much as possible, improving signal quality.
When the RSI indicator shows overbought or oversold signals while the price breaks through or pulls back the upper and lower rails of the Bollinger Bands, trading opportunities will emerge. It combines the advantages of the two different indicators, taking into account both the statistical characteristics of market fluctuations and the long/short stance of market participants to form a comprehensive basis for judgment.
Strategy Principle
For the RSI part, we monitor two RSI indicators with different cycle lengths at the same time. One with a shorter cycle is used to capture overbought and oversold signals, while one with a longer cycle is used to confirm trend reversals. When the short-cycle RSI shows overbought/oversold and the long-cycle RSI shows reversal, we believe a trading opportunity has formed.
For the Bollinger Bands part, we monitor whether the price breaks through the upper and lower rails. Breaking through the upper rail of the Bollinger Bands is the sell point, and breaking through the lower rail is the buy point. At the same time, we also monitor whether the price pulls back to the Bollinger Bands so that reversal opportunities can be captured in a timely manner.
When the RSI and Bollinger Bands signals appear simultaneously, we believe the trading opportunity has taken shape and a trading order is issued.
Advantage Analysis
- Dual indicator filtering provides higher reliability and avoids unnecessary trades
- Captures opportunities in both trend and reversal market stages
- Configurable parameters for adjustable settings as needed
- Embedded time and money management
Risk Analysis
- Improper Bollinger Bands parameter settings may cause false signals
- Unable to cope with extreme market volatility
- RSI divergence may generate incorrect signals
- Parameter optimization needed to adapt to different products and cycles
Risks can be avoided and controlled through parameter optimization, appropriately reducing positions, manual intervention, etc.
Optimization Directions
- Adjust RSI parameters to optimize overbought/oversold judgments
- Adjust Bollinger Bands width to optimize breakout strategies
- Add position management mechanism
- Add stop loss strategy
- Incorporate more indicators to build multi-factor models
Conclusion
The RSI and Bollinger Bands dual strategy fully utilizes the strengths of the two indicators to generate high-quality signals. With proper parameter optimization and risk management, it can achieve steady investment returns. Incorporating more signals and models is also a potential future direction.
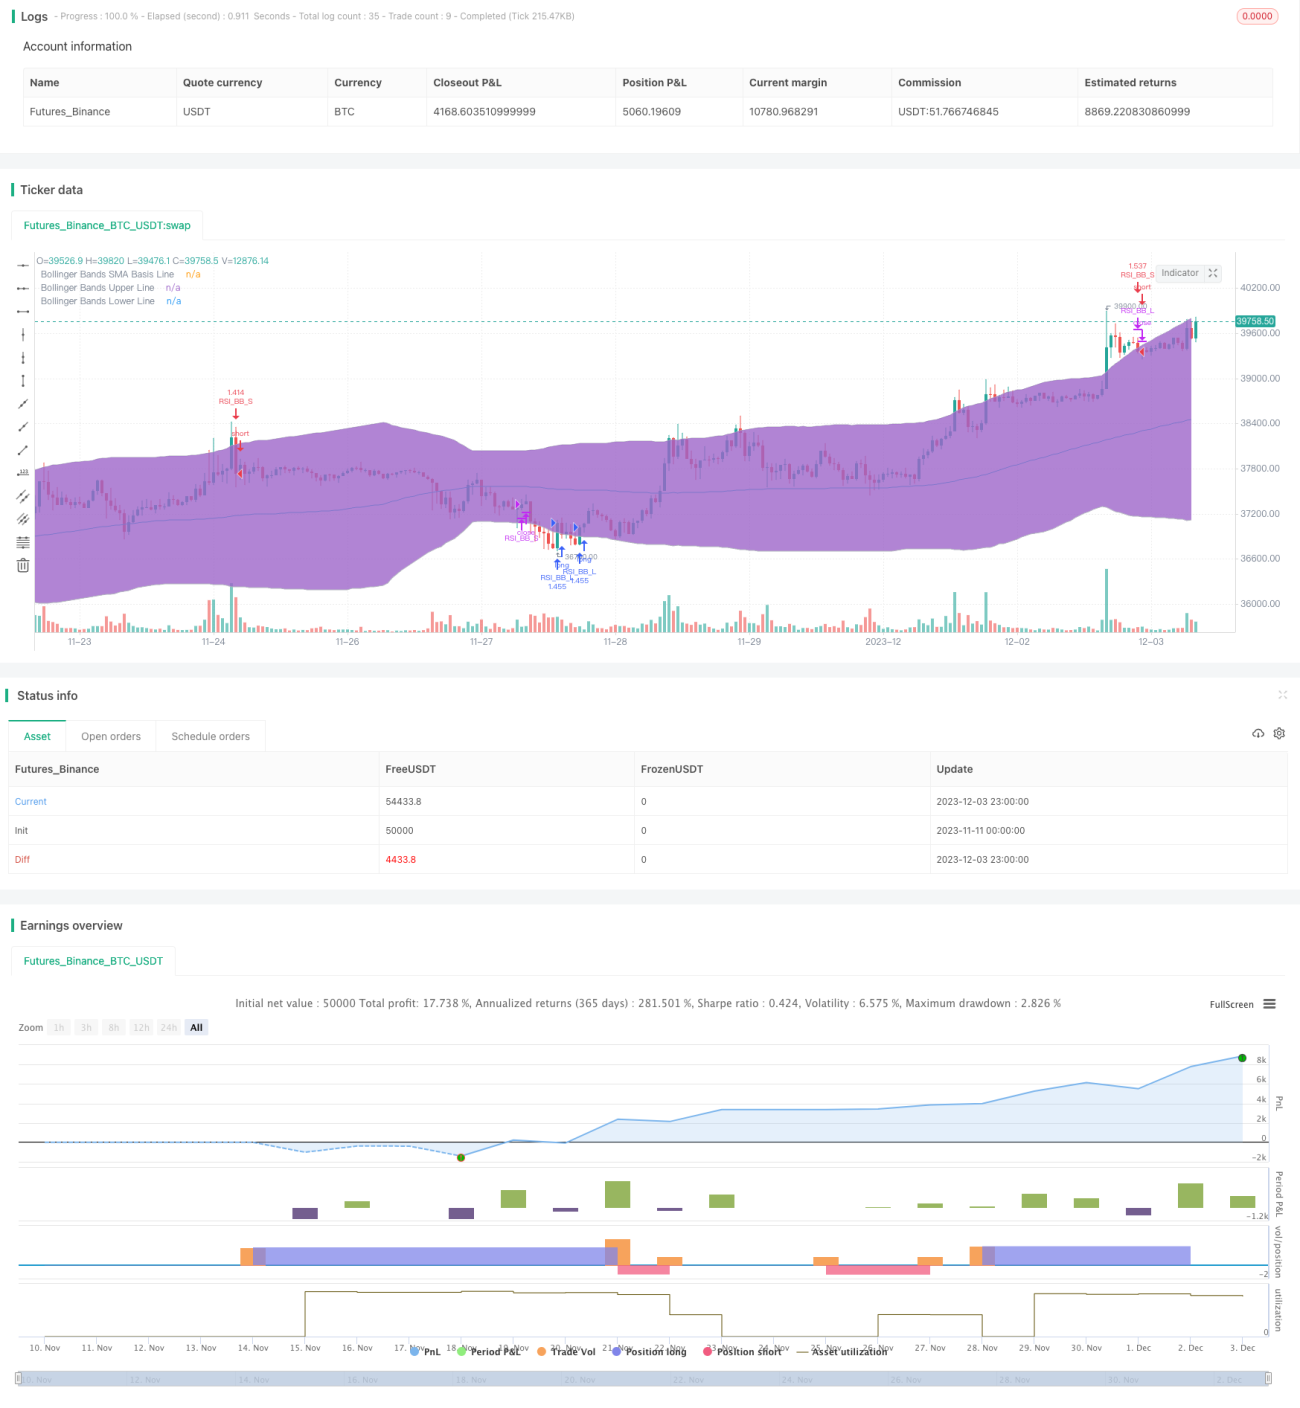
/*backtest
start: 2023-11-11 00:00:00
end: 2023-12-04 00:00:00
period: 1h
basePeriod: 15m
exchanges: [{"eid":"Futures_Binance","currency":"BTC_USDT"}]
*/

//@version=4
strategy("Ezieh Str.v2", shorttitle="Ezieh Str.v2", overlay=true, pyramiding=10, currency=currency.USD, slippage=3, commission_type=strategy.commission.cash_per_order, commission_value=0.04, initial_capital=1000)
- 1