概述
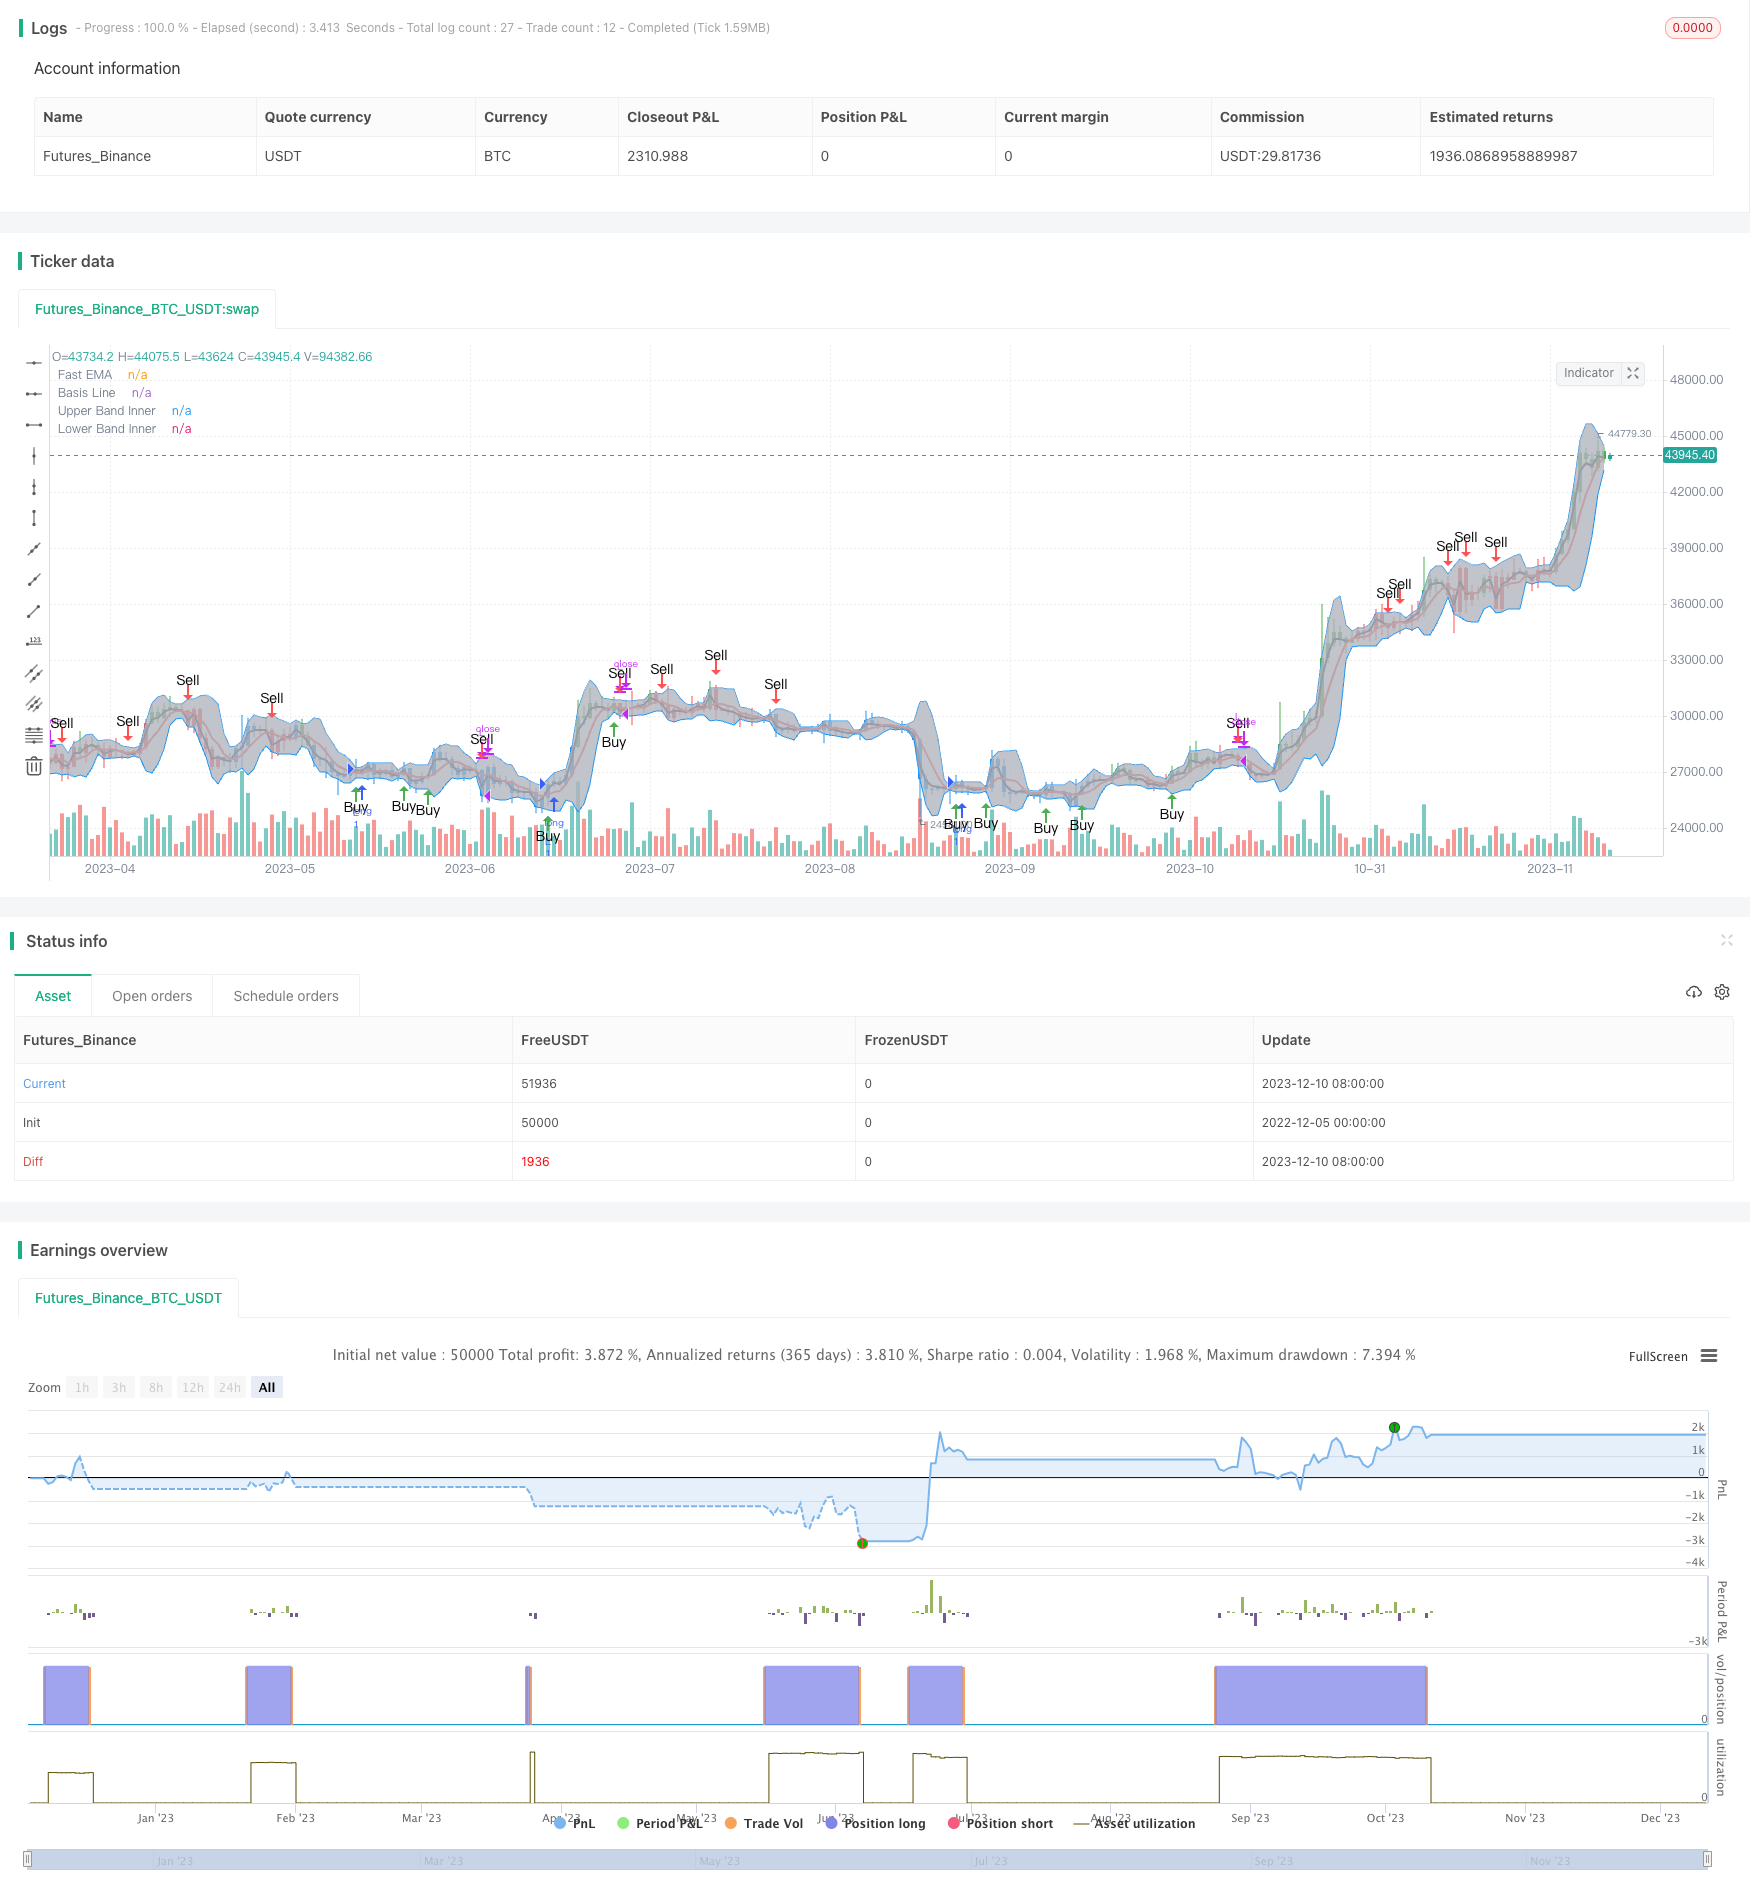
本策略结合了双波带指标和强势指数指标,实现了突破交易模式。当快速EMA突破波带通道时,结合AO指标的多空方向信号,产生买入和卖出信号。
策略原理
- 使用布林带的中轨、上轨和下轨判断价格通道。
- 快速EMA跨越中轨时,判断为通道突破。
- 强势指数AO指标判断多头和空头的方向。
- 当快速EMA向上突破中轨,且AO为正时,产生买入信号。
- 当快速EMA向下突破中轨,且AO为负时,产生卖出信号。
优势分析
- 双波带指标判断价格通道,避免错误信号。
- AO指标判断趋势方向,使交易信号更加准确。
- 结合通道突破的模式交易,可以在趋势开始阶段捕获更大利润。
风险分析
- 布林带参数不当可能导致通道太宽或太窄。
- AO指标参数设置会影响判断的准确性。
- 突破信号可能是假突破,需要确保有足够的突破力度。
解决方法
- 优化布林带和AO指标的参数,找到最佳组合。
- 增加突破的力度条件,避免假突破。
- 与其他指标组合使用,确保交易信号的可靠性。
优化方向
- 优化布林带的参数,找到最适合的通道范围。
- 优化AO指标的长短期均线参数,提高判断准确率。
- 增加volume或其他指标过滤,确保突破的可靠性。
- 优化突破力度参数,降低假突破率。
总结
本策略综合考虑了价格通道、趋势方向和突破模式,是一种较为稳定和高效的交易策略。通过参数优化和组合指标过滤,可以进一步增强策略的稳健性和收益率。其突破交易模式可以捕获趋势的早期机会,具有很大的实用价值。
策略源码
/*backtest
start: 2022-12-05 00:00:00
end: 2023-12-11 00:00:00
period: 1d
basePeriod: 1h
exchanges: [{"eid":"Futures_Binance","currency":"BTC_USDT"}]
*/

//@version=3

strategy(shorttitle="BB+AO STRAT", title="BB+AO STRAT", overlay=true)


// === BACKTEST RANGE ===
FromMonth = input(defval = 6, title = "From Month", minval = 1)
FromDay   = input(defval = 1, title = "From Day", minval = 1)
FromYear  = input(defval = 2018, title = "From Year", minval = 2014)
ToMonth   = input(defval = 1, title = "To Month", minval = 1)
ToDay     = input(defval = 1, title = "To Day", minval = 1)
ToYear    = input(defval = 9999, title = "To Year", minval = 2014)

// Bollinger Bands Inputs
bb_use_ema = input(false, title="Use EMA for Bollinger Band")
bb_length = input(5, minval=1, title="Bollinger Length")
bb_source = input(close, title="Bollinger Source")
bb_mult = input(2.0, title="Base Multiplier", minval=0.5, maxval=10)
// EMA inputs
fast_ma_len = input(2, title="Fast EMA length", minval=2)
// Awesome Inputs
nLengthSlow = input(34, minval=1, title="Awesome Length Slow")
nLengthFast = input(5, minval=1, title="Awesome Length Fast")


// Breakout Indicator Inputs
bb_basis = bb_use_ema ? ema(bb_source, bb_length) : sma(bb_source, bb_length)
fast_ma  = ema(bb_source, fast_ma_len)

// Deviation

dev = stdev(bb_source, bb_length)
bb_dev_inner = bb_mult * dev

// Upper bands
inner_high = bb_basis + bb_dev_inner
// Lower Bands
inner_low = bb_basis - bb_dev_inner

// Calculate Awesome Oscillator
xSMA1_hl2 = sma(hl2, nLengthFast)
xSMA2_hl2 = sma(hl2, nLengthSlow)
xSMA1_SMA2 = xSMA1_hl2 - xSMA2_hl2
// Calculate direction of AO
AO = xSMA1_SMA2>=0? xSMA1_SMA2 > xSMA1_SMA2[1] ? 1 : 2 : xSMA1_SMA2 > xSMA1_SMA2[1] ? -1 : -2


// === PLOTTING ===

// plot BB basis
plot(bb_basis, title="Basis Line", color=red, transp=10, linewidth=2)
// plot BB upper and lower bands
ubi = plot(inner_high, title="Upper Band Inner", color=blue, transp=10, linewidth=1)
lbi = plot(inner_low, title="Lower Band Inner", color=blue, transp=10, linewidth=1)
// center BB channel fill
fill(ubi, lbi, title="Center Channel Fill", color=silver, transp=90)

// plot fast ma
plot(fast_ma, title="Fast EMA", color=black, transp=10, linewidth=2)

// Calc breakouts
break_down =   crossunder(fast_ma, bb_basis) and close < bb_basis and abs(AO)==2
break_up   =  crossover(fast_ma, bb_basis) and close > bb_basis and abs(AO)==1

// Show Break Alerts
plotshape(break_down, title="Breakout Down", style=shape.arrowdown, location=location.abovebar, size=size.auto, text="Sell", color=red, transp=0)
plotshape(break_up, title="Breakout Up", style=shape.arrowup, location=location.belowbar, size=size.auto, text="Buy", color=green, transp=0)
// === ALERTS ===


strategy.entry("L", strategy.long, when=(break_up and (time > timestamp(FromYear, FromMonth, FromDay, 00, 00)) and (time < timestamp(ToYear, ToMonth, ToDay, 23, 59))))


strategy.close("L", when=(break_down and (time < timestamp(ToYear, ToMonth, ToDay, 23, 59))))

// === /PLOTTING ===
barcolor(AO == 2 ? red: AO == 1 ? green : blue )


// eof