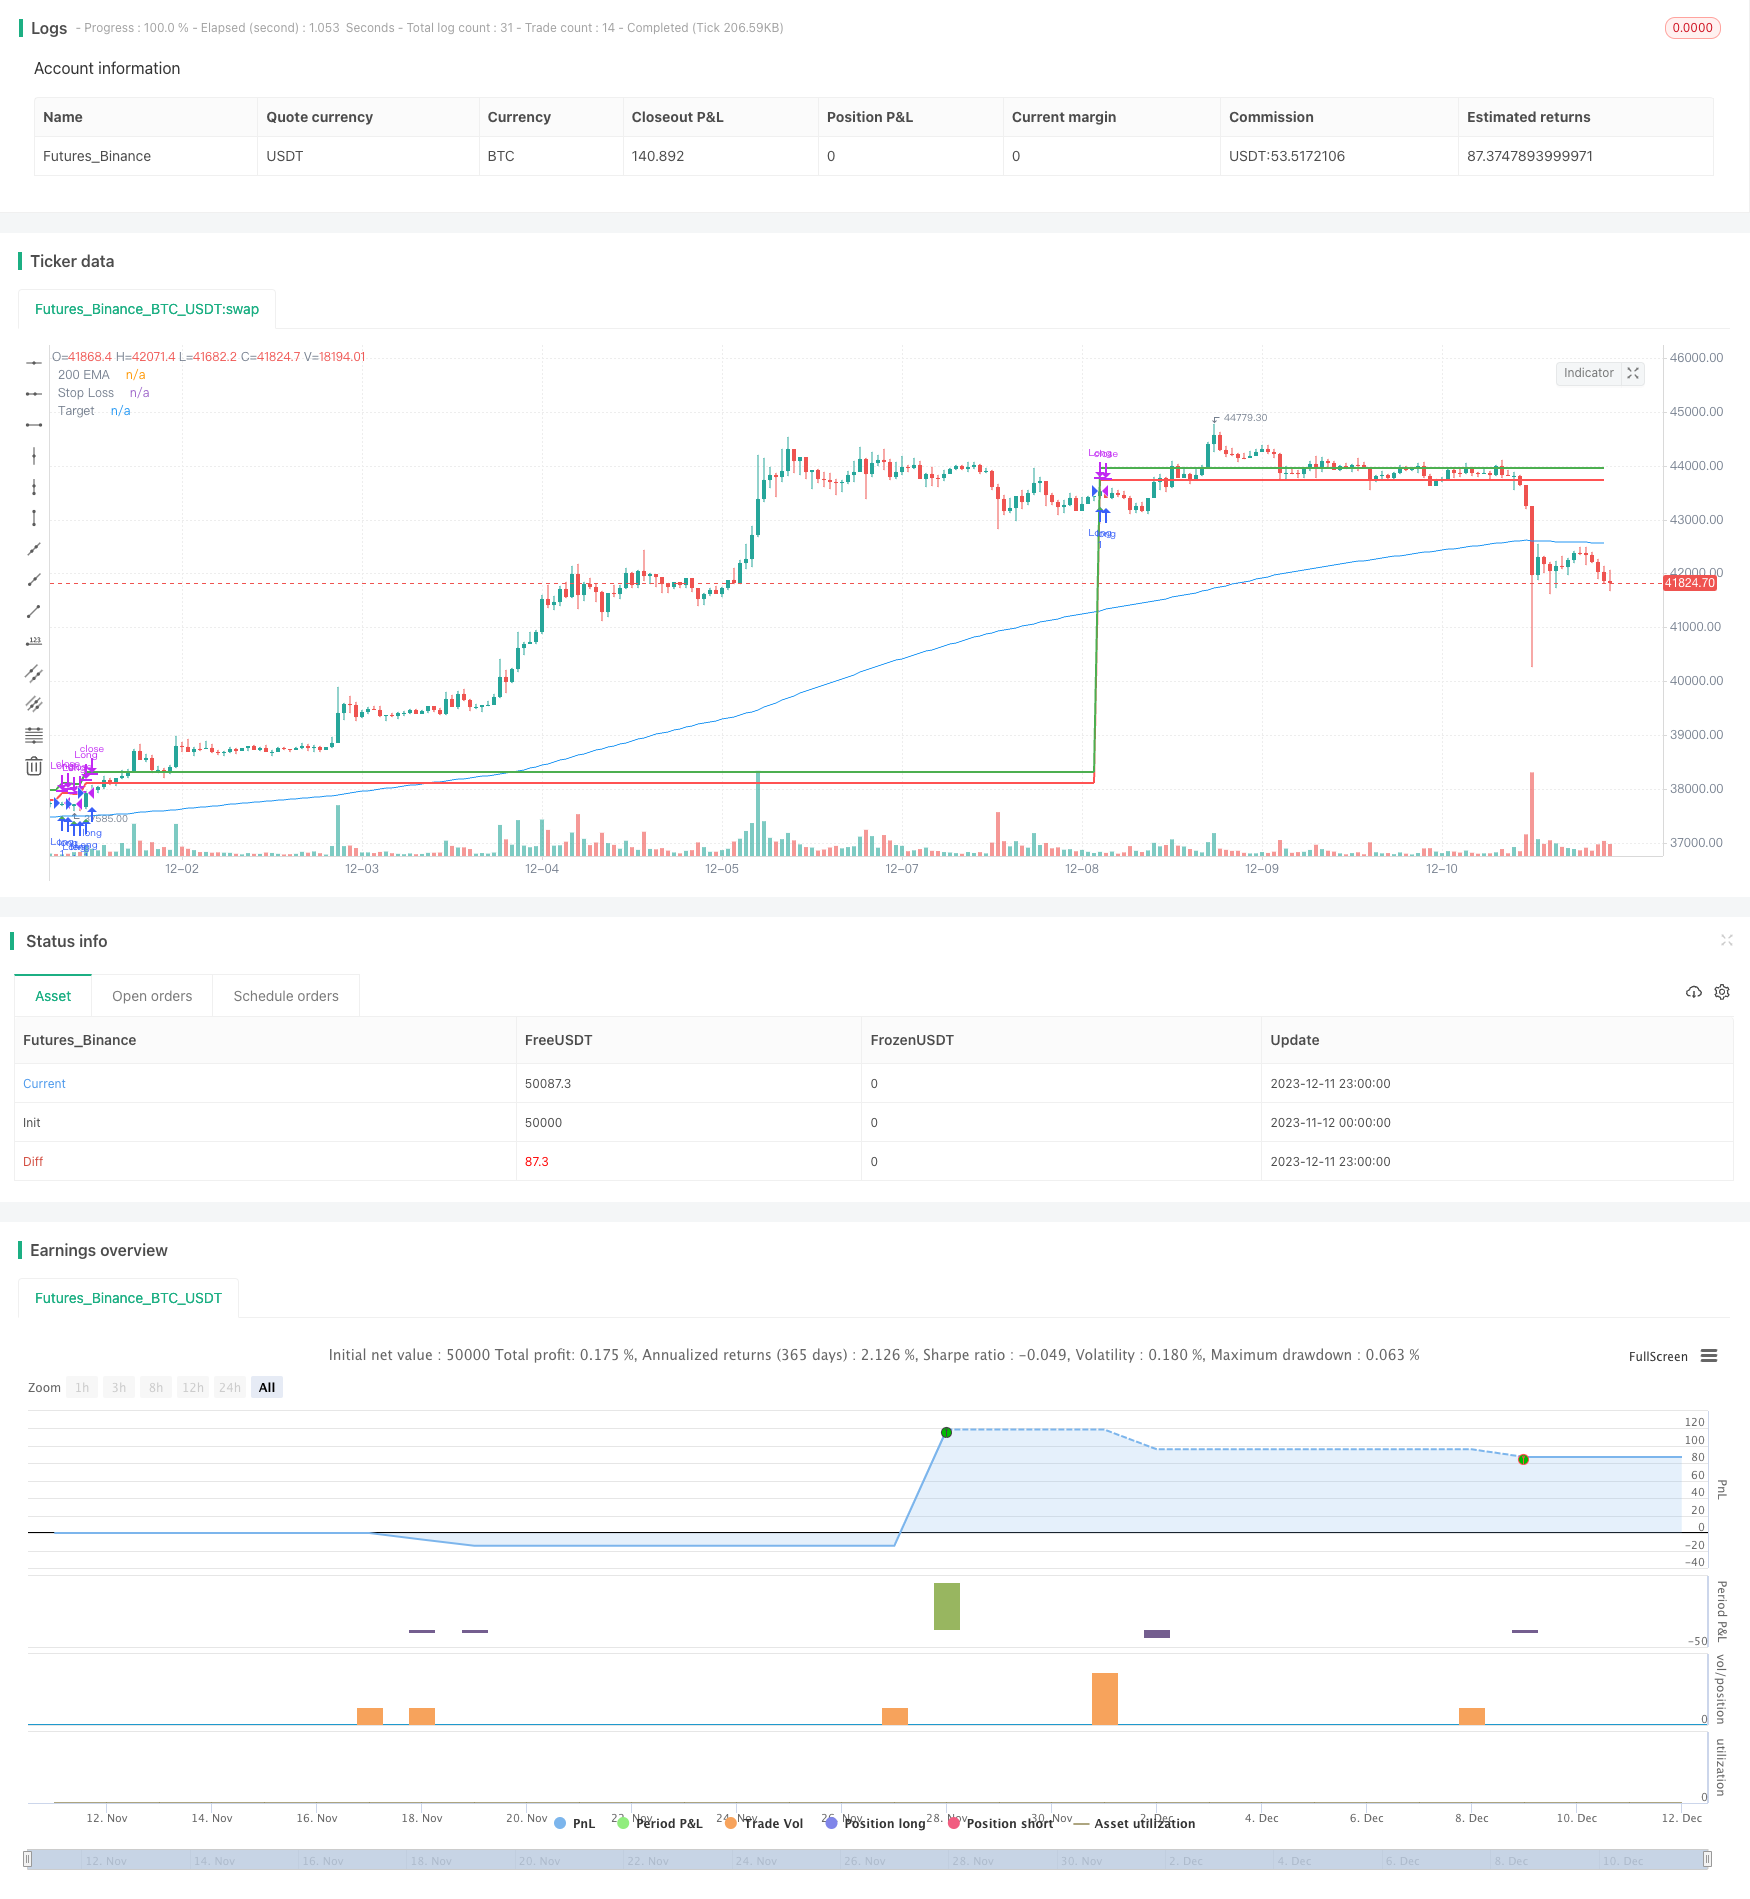
概述
本策略结合MACD指标识别短期趋势和200日均线判断长期趋势,在MACD金叉并低位运行时,如果价格突破200日均线,采取追踪止损的方式构建长仓。该策略主要利用MACD指标的金叉死叉和200日均线的位置关系,识别潜在机会。
策略原理
该策略主要基于MACD指标和200日均线这两个技术指标进行判断,具体逻辑是:
计算MACD指标的快线、慢线和MACD线。其中快线参数为12日,慢线参数为26日,信号线参数为9日。
计算200日的指数移动平均线EMA。
当满足MACD快慢线金叉(快线上穿慢线)、MACD线为负值(低位运行)、收盘价高于200日线时,做多入场。
入场后,设置止损价位为入场价的0.5%,目标价位为入场价的1%。
如果价格触及止损或目标价位,则止损或止盈退出仓位。
每日收盘前15:15强制平仓离场。
交易时间设置为每天9:00至15:15。
通过MACD指标判断短期趋势方向和力度,结合200日均线判断长期趋势方向,实现趋势追踪操作。止损设置较小,目标价位较大,实现盈利的最大化。每日强制离场则可控制隔夜风险。
策略优势
该策略具有以下优势:
多指标结合,判断信号更加准确。MACD判断短期趋势与力度,200日均线判断主要趋势方向。
止损幅度小,可以承受一定回撤。止损仅为0.5%,有利于追踪趋势中期行情。
目标利润率大,利润空间更大。目标为入场价的1%,满足趋势策略的利润最大化。
每日强制平仓,可以规避隔夜大幅波动的风险,控制风险。
策略思路简单清晰,容易理解与复制,适合新手学习。
策略风险
该策略也存在一些风险:
衰竭风险。快速上涨后价格可能反转下跌,无法及时止损而造成较大损失。可以设置trailer止损方式,根据价格实时调整止损位置。
趋势判断失败风险。MACD指标与均线可能发出错误信号,进入非趋势市场而造成损失。可以考虑结合交易量指标进行过滤,确保只在趋势加速阶段入场。
隔夜波动风险。即使设置了每日强制平仓机制,隔夜期间市场仍有可能出现断层,带来较大亏损。这需要交易者承受一定程度的风险,同时控制整体仓位规模。
策略优化方向
该策略还可以从以下几个方向进行优化:
结合交易量指标判断真实趋势,避免在震荡调整中错误入场。例如设置成交量必须大于前一周期10%时才能入场。
设置动态止损方式。入场后根据价格实时调整止损位置,追踪止损以锁定更多利润。
优化MACD参数组合,测试不同的参数在不同市场中的实际效果。参数设置会影响信号的灵敏度。
测试其他均线指标。例如100日线、150日线等,判断哪个均线与趋势吻合程度更高。
添加再入场机制。因为设置了强制每日离场,所以有可能错过后续行情。可以添加再入场信号,在次日继续持仓。
总结
该策略整合MACD指标和200日均线判断信号,在短期指标发出持续信号时,趋势性入场,并设置止损与止盈机制。同时每日强制平仓控制隔夜风险。策略思路简单,容易操作,适合新手学习,也可作为模块集成到其他策略中。但也存在一定的趋势判断错误风险与衰竭风险,这需要交易者具备一定的风险承受能力。下一步可以从止损方式、参数选择、交易量过滤等方面进行优化,提高策略profit因子。
/*backtest
start: 2023-11-12 00:00:00
end: 2023-12-12 00:00:00
period: 1h
basePeriod: 15m
exchanges: [{"eid":"Futures_Binance","currency":"BTC_USDT"}]
*/

//@version=4
strategy("MACD and 200 EMA Long Strategy", shorttitle="MACD200EMALong", overlay=true)

// Input parameters
fastLength = input(12, title="Fast Length")
slowLength = input(26, title="Slow Length")
signalLength = input(9, title="Signal Length")
ema200Length = input(200, title="200 EMA Length")
stopLossPercentage = input(0.5, title="Stop Loss Percentage")
targetPercentage = input(1, title="Target Percentage")

// Trading session
startHour = input(09, title="Start Hour", minval=0, maxval=23)
startMinute = input(00, title="Start Minute", minval=0, maxval=59)
endHour = input(15, title="End Hour", minval=0, maxval=23)
endMinute = input(15, title="End Minute", minval=0, maxval=59)

// Calculate MACD
[macdLine, signalLine, _] = macd(close, fastLength, slowLength, signalLength)

// Calculate 200-period EMA
ema200 = ema(close, ema200Length)

// Conditions for entering a long position
longCondition = crossover(macdLine, signalLine) and macdLine < 0 and close > ema200 and hour < 13

// Calculate stop loss and target levels only once at the entry
var float stopLossLevel = na
var float targetLevel = na

if (longCondition)
    stopLossLevel := close * (1 + stopLossPercentage / 100)


    targetLevel := close * (1 + targetPercentage / 100)

// Trading session condition
intradayCondition = true

// Strategy logic
strategy.entry("Long", strategy.long, when=longCondition and intradayCondition)
strategy.exit("Take Profit/Stop Loss", from_entry="Long", loss=stopLossLevel, profit=targetLevel)

// Force exit if the current close is below the stop loss level
if (not na(stopLossLevel) and close < stopLossLevel)
    strategy.close("Long")

// Exit the trade if the current close is greater than or equal to the target level
if (not na(targetLevel) and close >= targetLevel)
    strategy.close("Long")

// Manually force exit at 3:15 PM
if (hour == 15 and minute == 15)
    strategy.close("Long")

// Plotting the EMA, target, and stop loss on the chart
plot(ema200, color=color.blue, title="200 EMA")
plot(stopLossLevel, color=color.red, title="Stop Loss", linewidth=2)
plot(targetLevel, color=color.green, title="Target", linewidth=2)

// Plot entry arrow
plotshape(series=longCondition and intradayCondition, title="Long Entry", color=color.green, style=shape.triangleup, location=location.belowbar)