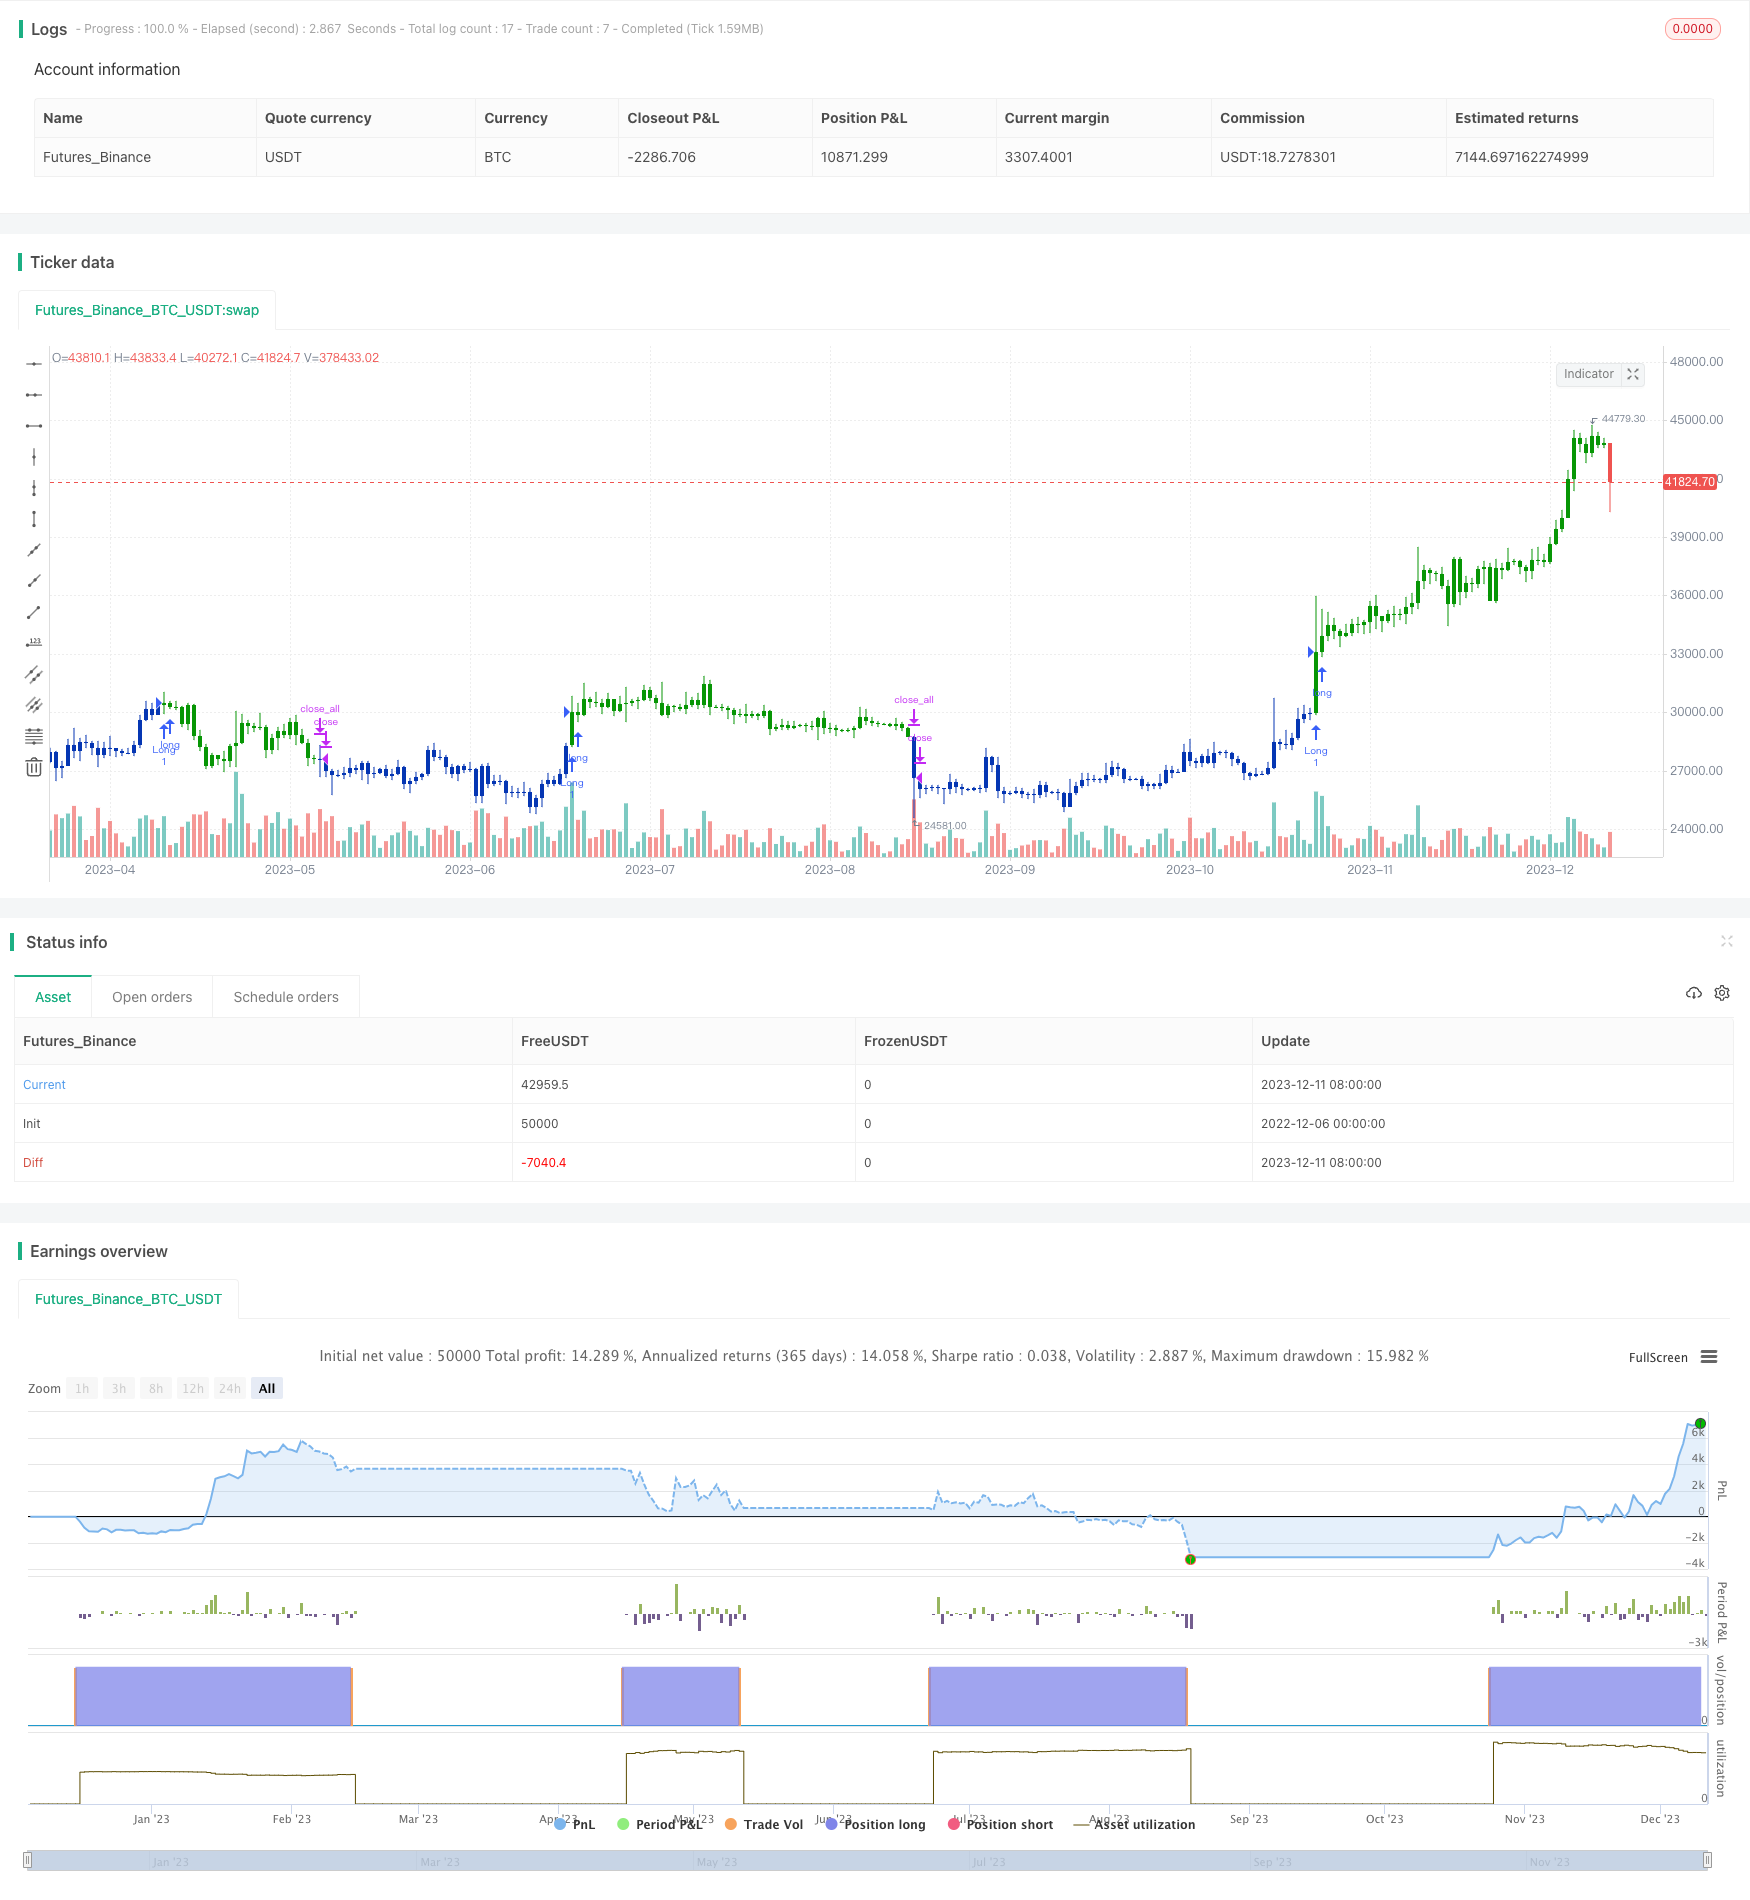
概述
该策略首先结合了Ulf Jensen在他的著作《我如何在期货市场上将资金翻三番》第183页中提出的反转策略与比较相对强度指标,进行组合以获取更强的信号。该组合策略名为“基于逆转与相对强度的组合量化策略”。
该策略的主要思路是同时利用多个因子进行判断,结合反转因子和比较相对强度这两个信号,在两者同时发出信号时才进行买入或卖出,以提高策略的稳定性。
策略原理
第一部分为逆转策略。该策略在以下条件下做多:最近两天的收盘价连续上涨,且9日Stochastic慢线位于50以下。平仓条件为:最近两天的收盘价连续下跌,且9日Stochastic快线位于50以上。
第二部分为比较相对强度指标。该指标计算目标股票与标的指数的N日收盘价变化率的移动平均,并与事先设置的买入带、卖出带和平仓带进行比较。当指标上穿买入带时做多,下穿卖出带时做空,在做多情况下下穿平仓带时平仓,在做空情况下上穿平仓带时平仓。
该组合策略会同时判断两部分的信号,只有当两者都发出相同的信号(双买入或双卖出)时,才会进行相应的买入或卖出操作。
优势分析
该策略结合反转因子和相对强度因子,能够发挥两者的优势。反转策略能捕捉短期上的极端点;相对强度策略能把握大市的主要趋势。两者同时发出信号,可以提高信号的可靠性,过滤掉一部分噪声导致的错误信号。
另外,Stochastic 指标作为一个超买超卖区分指标,能较好地判断反转点。组合使用移动平均线之类的趋势指标,也可以形成比较成熟的组合策略。
风险分析
反转策略最大的风险在于无法判断市场反转的时间点,可能发生亏损后继续反向运动的情况。这时相对强度指标可以发挥作用,判断大趋势是否发生转变。
相对强度策略的风险在于指标参数设置不当,导致产生太多错误信号。这时反转策略可以起到过滤作用,减少不必要的交易。
优化方向
该策略可以从以下几个方面进行优化:
测试更多的反转因子,寻找更优反转策略。目前使用的只是简单的N日新高/新低统计策略。
对相对强度指标的参数进行测试与优化,找到最佳参数组合。当前参数设置较为主观,可能并非最优。
增加止损策略。该策略目前没有设置止损,增加合理的止损可以控制亏损风险。
可以测试不同的标的指数,再与目标股票计算相对强度,寻找最匹配的指数。
总结
该策略结合反转因子与相对强度因子进行交易,能利用两者的优势提高信号质量,是一种比较成熟的组合策略。该策略优化空间还很大,通过参数优化、止损策略以及策略组合方式的调整,还可以获得更好的效果。
/*backtest
start: 2022-12-06 00:00:00
end: 2023-12-12 00:00:00
period: 1d
basePeriod: 1h
exchanges: [{"eid":"Futures_Binance","currency":"BTC_USDT"}]
*/

//@version=4
////////////////////////////////////////////////////////////
//  Copyright by HPotter v1.0 30/10/2019
// This is combo strategies for get a cumulative signal.
//
// First strategy
// This System was created from the Book "How I Tripled My Money In The
// Futures Market" by Ulf Jensen, Page 183. This is reverse type of strategies.
// The strategy buys at market, if close price is higher than the previous close
// during 2 days and the meaning of 9-days Stochastic Slow Oscillator is lower than 50.
// The strategy sells at market, if close price is lower than the previous close price
// during 2 days and the meaning of 9-days Stochastic Fast Oscillator is higher than 50.
//
// Second strategy
// Comparative Relative Strength Strategy for ES
//
// WARNING:
// - For purpose educate only
// - This script to change bars colors.
////////////////////////////////////////////////////////////
Reversal123(Length, KSmoothing, DLength, Level) =>
    vFast = sma(stoch(close, high, low, Length), KSmoothing)
    vSlow = sma(vFast, DLength)
    pos = 0.0
    pos := iff(close[2] < close[1] and close > close[1] and vFast < vSlow and vFast > Level, 1,
	         iff(close[2] > close[1] and close < close[1] and vFast > vSlow and vFast < Level, -1, nz(pos[1], 0)))
	pos

CRS(a, b, len, BuyBand, SellBand, CloseBand) =>
    pos = 0.0
    as = security(a, timeframe.period, close)
    bs = security(b, timeframe.period, close)
    nRes = sma(as/bs, len)
    pos := iff(nRes > BuyBand, 1,
	         iff(nRes < SellBand, -1,
	          iff(pos[1] == 1 and nRes < CloseBand, 0,
    	       iff(pos[1] == -1 and nRes > CloseBand, 0, nz(pos[1], 0)))))
    pos

strategy(title="Combo Backtest 123 Reversal & Comparative Relative Strength", shorttitle="Combo", overlay = true)
Length = input(14, minval=1)
KSmoothing = input(1, minval=1)
DLength = input(3, minval=1)
Level = input(50, minval=1)
//-------------------------
a = syminfo.tickerid
b = input("BTC_USDT:swap", type=input.symbol)
LengthCRS = input(10)
BuyBand = input(0.9988, step = 0.0001)
SellBand = input(0.9960, step = 0.0001)
CloseBand = input(0.9975, step = 0.0001)
reverse = input(false, title="Trade reverse")
posReversal123 = Reversal123(Length, KSmoothing, DLength, Level)
posCRS = CRS(a, b, LengthCRS, BuyBand, SellBand, CloseBand)
pos = iff(posReversal123 == 1 and posCRS == 1 , 1,
	   iff(posReversal123 == -1 and posCRS == -1, -1, 0))
possig = iff(reverse and pos == 1, -1,
          iff(reverse and pos == -1 , 1, pos))
if (possig == 1)
    strategy.entry("Long", strategy.long)
if (possig == -1)
    strategy.entry("Short", strategy.short)
if (possig == 0)
    strategy.close_all()
barcolor(possig == -1 ? #b50404: possig == 1 ? #079605 : #0536b3 )