Volume Weighted Moving Average Convergence Divergence

Overview
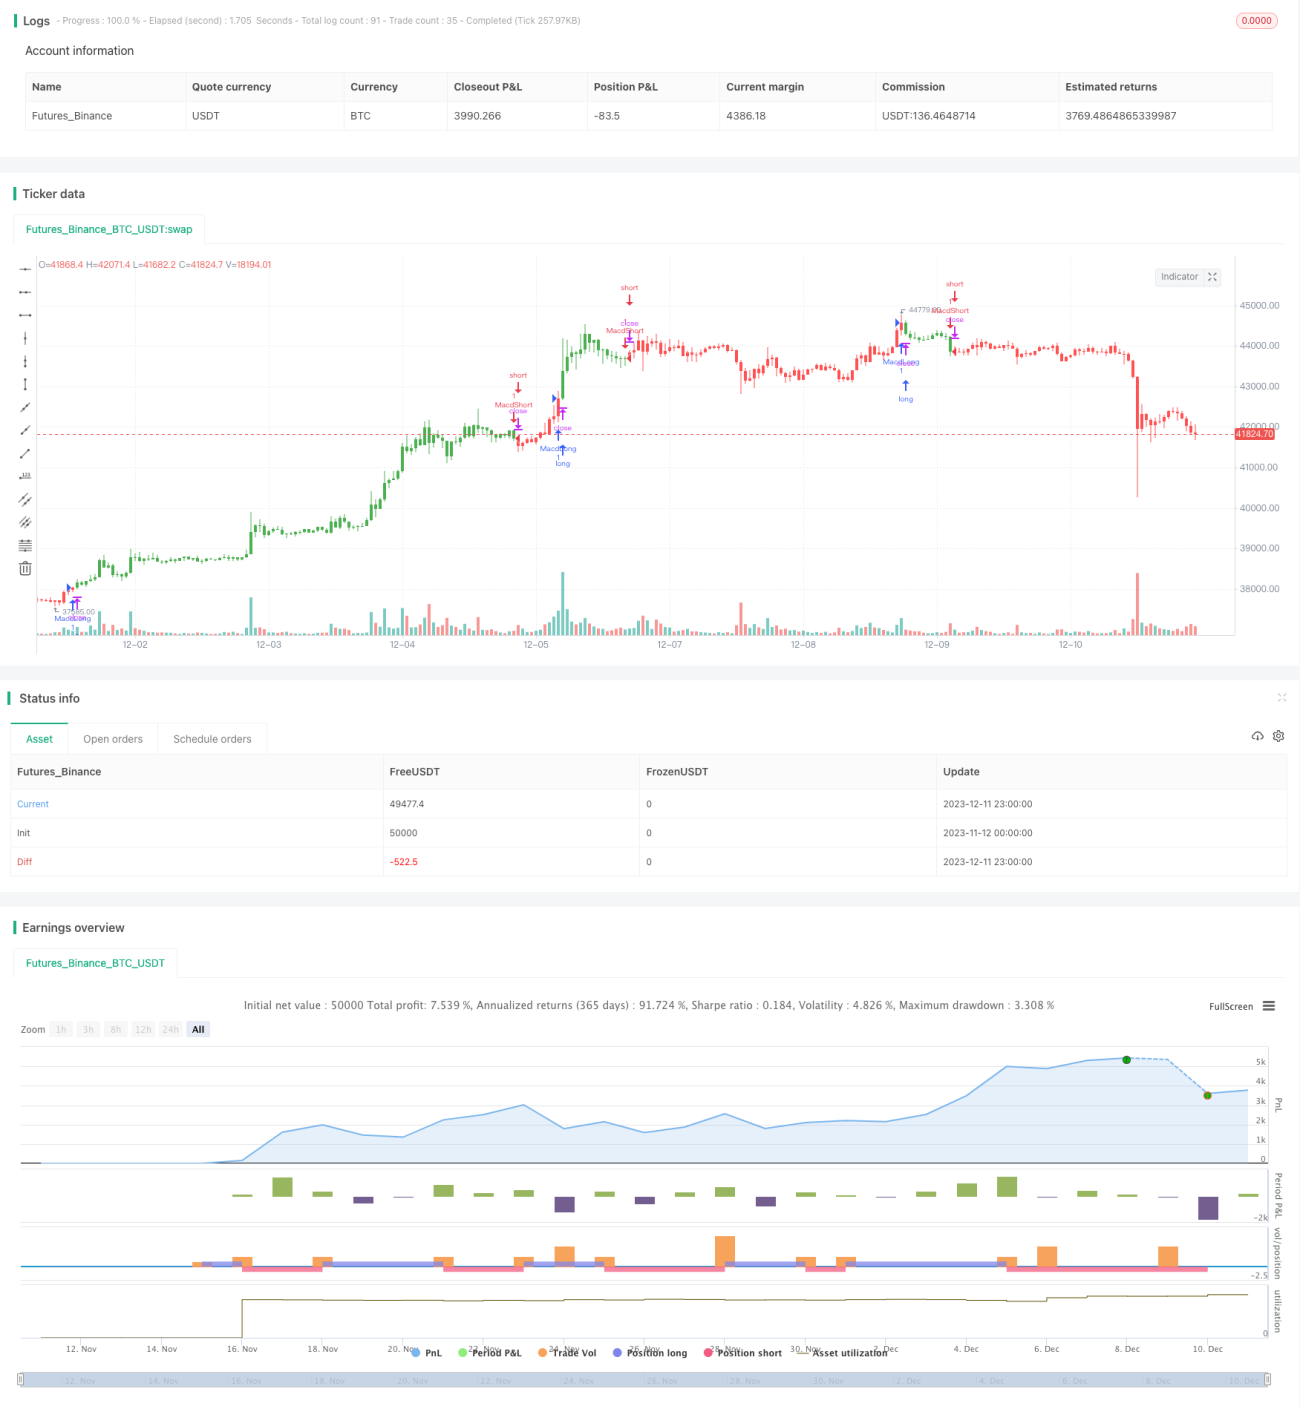
This strategy is an improved version of the classic MACD indicator, using 11 different types of moving averages to smooth the price curve and reduce misleading signals. The indicator consists of the fast line, slow line and histogram. The fast line and slow line respectively adopt the fast moving average and slow moving average of prices. The histogram represents the difference between the fast line and slow line. Buying signals are generated when the fast line crosses the slow line from bottom to top, while selling signals are generated from top to bottom.
Strategy Principles
-
Calculate the fast moving average line MA12. 11 different calculation methods for moving average lines are available for selection, with Volume Variability Rate line VAR as default.
-
Calculate the slow moving average line MA26. 11 different calculation methods for moving average lines are available for selection, with Volume Variability Rate line VAR as default.
-
Calculate the difference between the fast and slow lines SRC2 = MA12 - MA26.
-
Calculate the trigger line MATR for SRC2 using a moving average line with length of 9. 11 different calculation methods are available for selection, with Volume Variability Rate line VAR as default.
-
Calculate the MACD histogram HIST = SRC2 - MATR. Buying signals are generated when the histogram changes from negative to positive. Selling signals are generated when the histogram changes from positive to negative.
Analysis of Advantages
-
11 different types of moving average lines can be selected to calculate the fast line, slow line and trigger line, which largely reduces the lagging of common moving averages and improves the accuracy of prediction signals.
-
The Volume Variability Rate line VAR can automatically adjust the weights of the moving average to better adapt to market changes.
-
The double moving average lines with buffer zone can effectively filter out market noise.
-
The MACD histogram as the triggering signal can overcome the lagging problem brought by the traditional crossing of fast and slow MACD lines.
Risk Analysis
-
MACD indicator has weak capability in judging the trending or consolidating market.
-
The moving average itself has a certain degree of lagging. VAR partially reduces but cannot completely solve the problem.
-
Error accumulation may lead to wrong signals or missing effective signals.
Direction for Optimization
-
Choose matching moving average calculation methods for specific market conditions based on backtest results.
-
Optimize the length parameters of the fast line, slow line and trigger line to find the best parameter combinations to reduce wrong signals.
-
Add auxiliary indicators such as RSI and Bollinger Bands to confirm buy/sell signals.
Conclusion
This strategy is an optimized version for the classic MACD indicator. By using multiple moving average patterns to compute the MACD fast line, slow line and histogram, it greatly enhances the utility of this indicator. Meanwhile, it also has certain limitations. Continuous optimization catered to actual market conditions is needed to maximize the efficacy in trading.
- 1