Stochastic RSI Strategy for Cryptocurrency Trading

I. Strategy Overview
This strategy is named "Stochastic RSI Strategy for Cryptocurrency Trading". It combines the Relative Strength Index (RSI) and Stochastic RSI indicators to identify buy and sell signals for cryptocurrencies.
The main idea behind the strategy is: First calculate the RSI value, then construct the Stochastic RSI indicator based on RSI, namely the K and D values. When the K value crosses above the D value, a buy signal is generated. When the K value crosses below the D value, a sell signal is generated. To filter out false signals, the strategy also introduces the Rate of Change Index (RVI) and its moving average line for confirmation.
II. Detailed Principles of the Strategy
-
Calculate the 14-period RSI value.
-
Construct a 14-period Stochastic RSI indicator based on RSI to obtain K and D values (D is the 3-period moving average of K).
-
Calculate the 5-period RVI and its signal line (the moving average of RVI).
-
When K crosses above D, if RVI > Signal Line and last period's RVI < Signal Line, a buy signal is generated. When K crosses below D, if RVI < Signal Line and last period's RVI > Signal Line, a sell signal is generated.
-
Open long or short positions based on the generated signals.
III. Advantage Analysis
-
The combination of Stochastic RSI and dual confirmation from RVI can effectively filter out false signals.
-
The RVI indicator can reflect short-term overbought/oversold conditions and avoids opening positions at extreme points.
-
The Stochastic RSI indicator identifies overbought/oversold zones. It uses the golden/dead cross of the KDJ indicator to determine entry points.
-
Backtest results show this strategy has achieved good performance on some cryptocurrency pairs (such as FCT/BTC).
IV. Risk Analysis
-
Improper stop loss placement of similar trailing stop strategies may lead to being stopped out prematurely.
-
High signal frequency may lead to excessive trading fees that should be taken into consideration.
-
Both the KDJ and RVI indicators may generate false signals, resulting in unnecessary losses.
-
The strategy parameters need to be optimized for different trading pairs. General applicability needs to be evaluated.
V. Optimization Directions
-
Add a moving stop loss to lock in profits. The ATR can be referenced to set stop loss levels.
-
Optimize RVI Parameters and Stochastic RSI parameters for cleaner signals.
-
Add trade size control to avoid excessively large single orders.
-
Add filtering mechanisms to avoid opening positions at unfavorable levels. Volatility indicators can be introduced to determine if the market is currently in a choppy state.
-
Test on different cryptocurrency pairs to find the best fit.
VI. Strategy Summary
This strategy first constructs a Stochastic RSI based on the RSI indicator, then uses the RVI indicator for confirmation, in order to detect short-term overbought/oversold conditions and open positions at turning points. The advantage is that dual confirmation can filter out false signals. The disadvantage is the risk of overfitting parameters. Overall, this strategy has achieved good results on some trading pairs. Further optimizations can obtain more consistent profits.
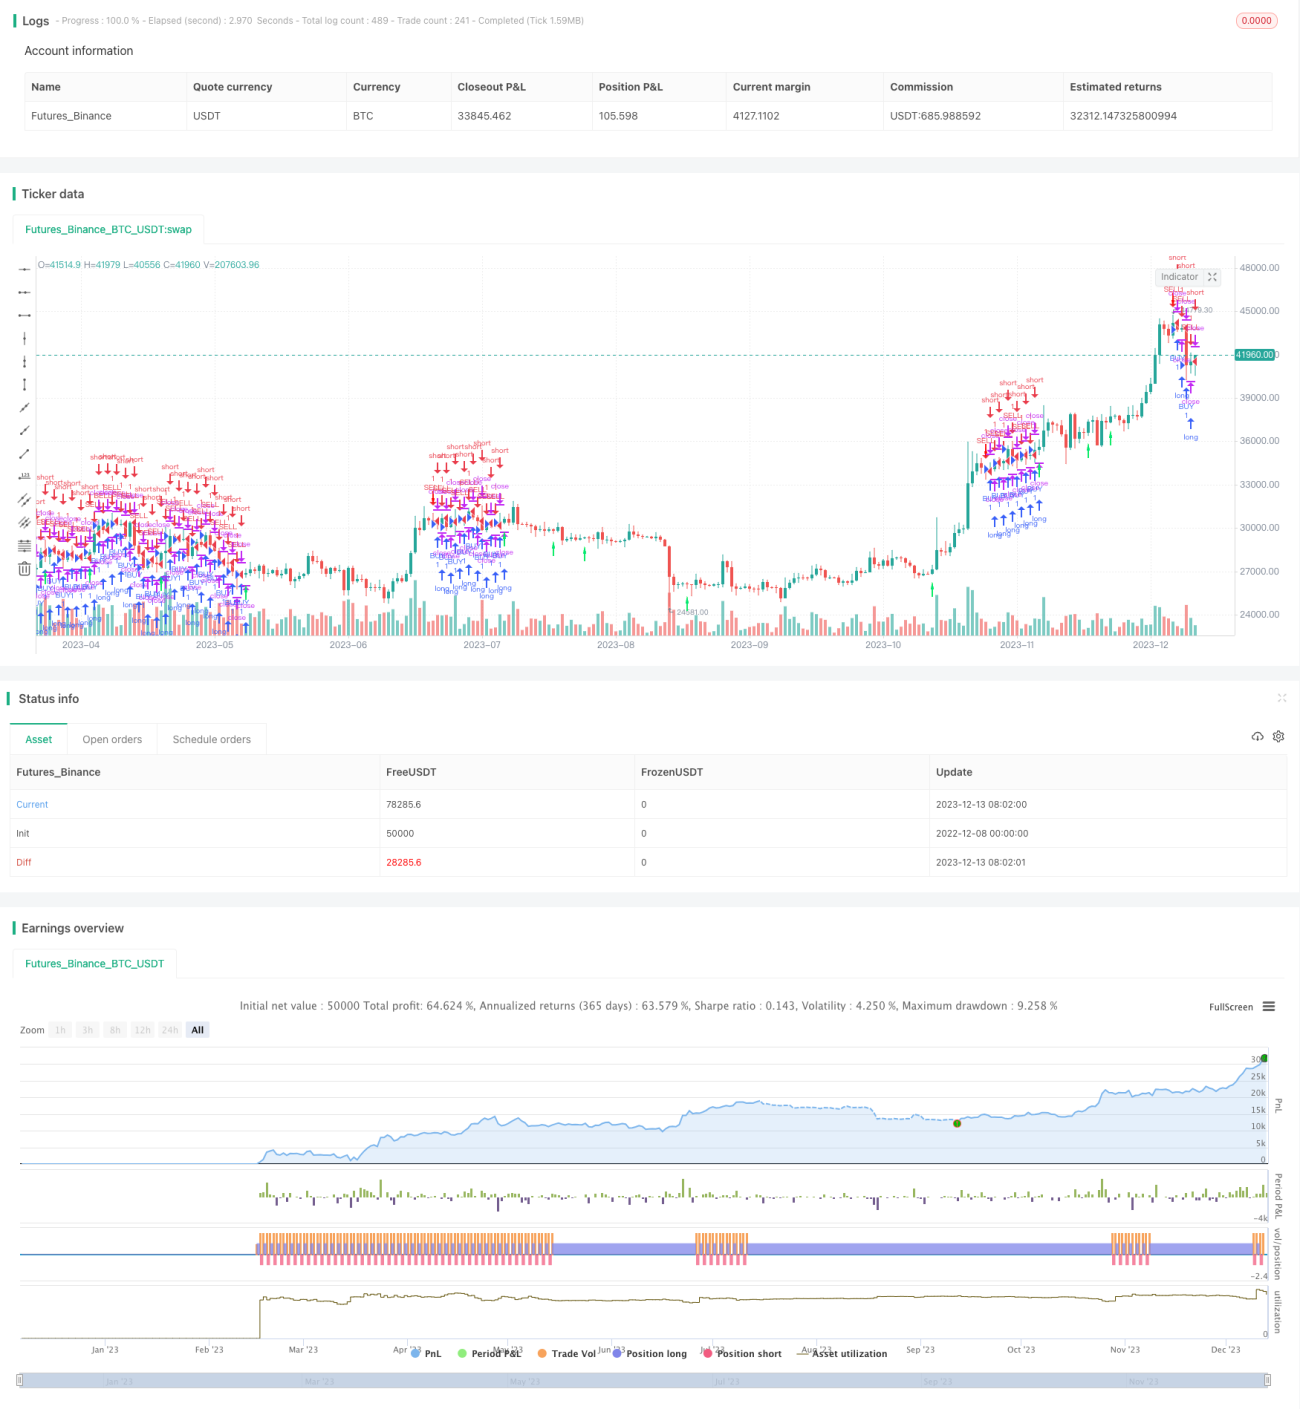
/*backtest
start: 2022-12-08 00:00:00
end: 2023-12-14 00:00:00
period: 1d
basePeriod: 1h
exchanges: [{"eid":"Futures_Binance","currency":"BTC_USDT"}]
*/

//@version=4
strategy(title="Stochastic RSI", shorttitle="Stoch RSI", overlay = true)
Per = input(5, title="Length", minval=1)
smoothK = input(3, minval=1)- 1