Stochastic Crossover Long and Short Strategy

Overview
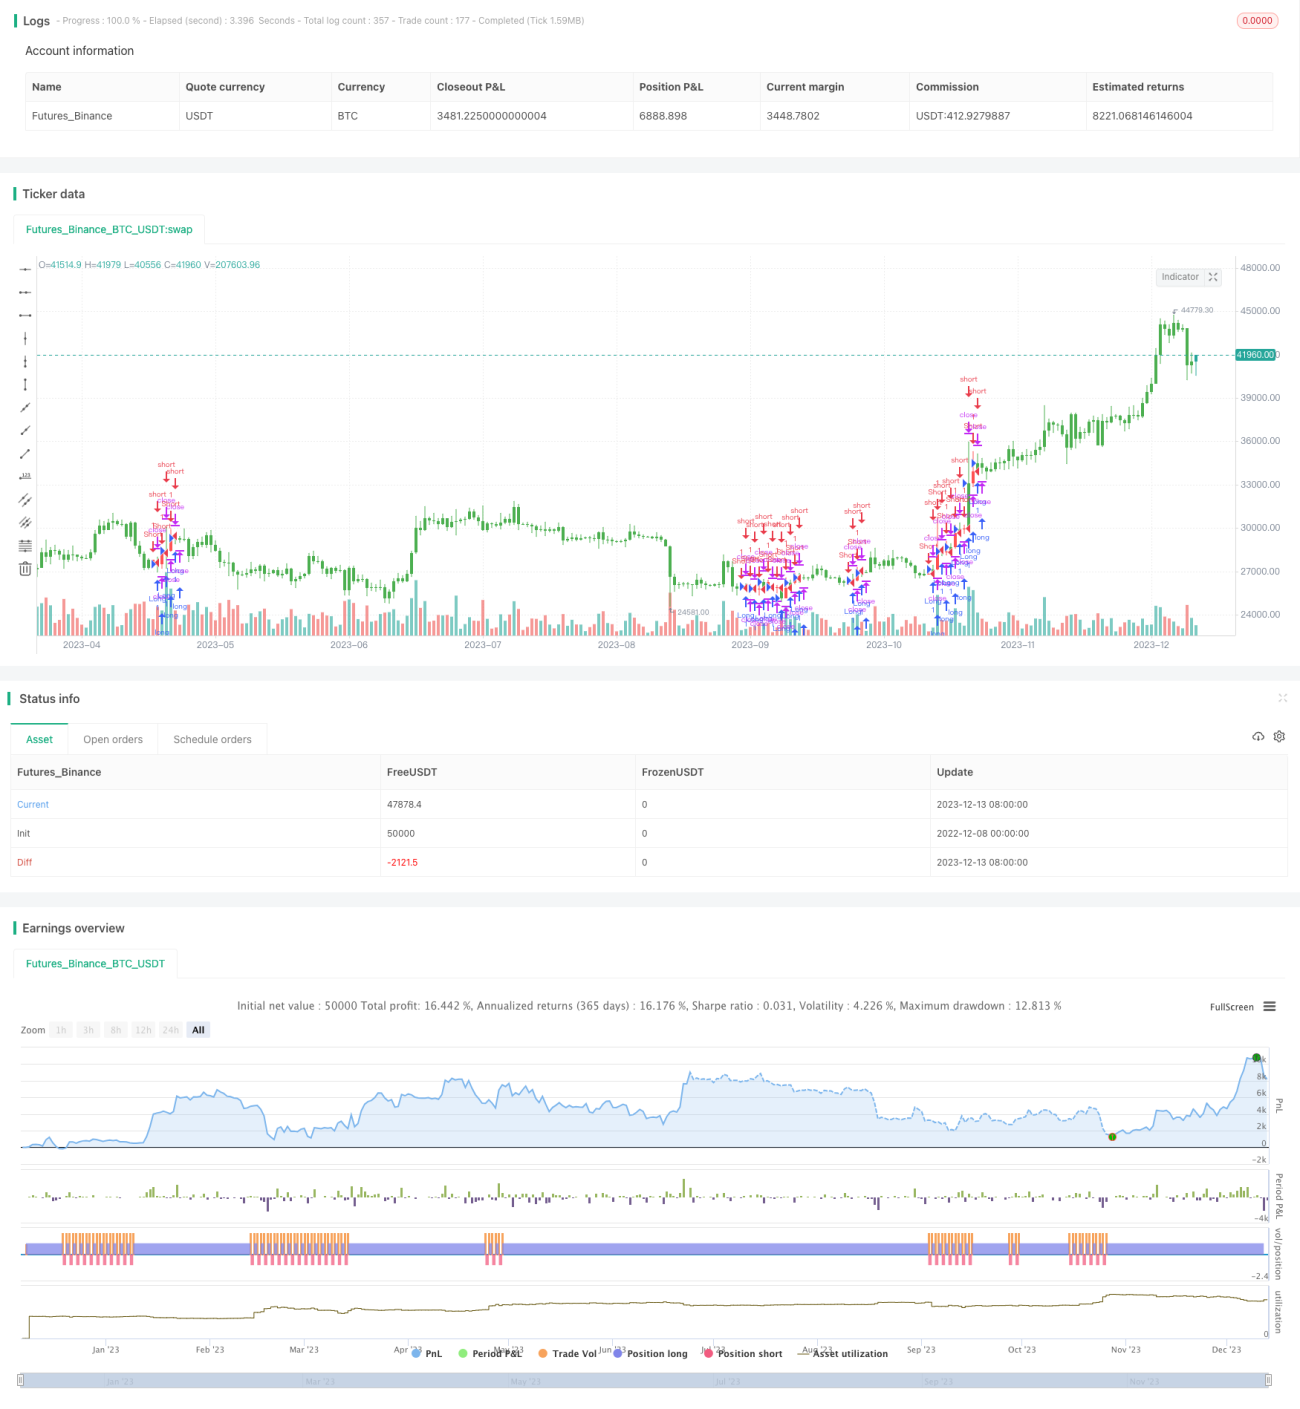
This strategy generates trading signals based on the golden cross and death cross of %K line and %D line of the Stochastic indicator. It goes short when %K line crosses below %D line while both are in the overbought area, and goes long when %K line crosses above %D line while both are in the oversold area. The strategy captures the reversal characteristic of Stochastic indicator and forms trading signals around trend turning points.
Strategy Logic
The strategy utilizes two lines, %K and %D, of the Stochastic indicator. %K line shows the current closing price relative to the highest and lowest prices over a certain period, and %D line is the M-day simple moving average of %K line.
When %K line crosses below %D line, it indicates the start of a downward trend, and together with both lines in the overbought area, it signals the critical point for price reversal, so a short position is taken.
When %K line crosses above %D line, it indicates the start of an upward trend, and together with both lines in the oversold area, it signals the critical point for price reversal, so a long position is taken.
By capturing the reversal moments of Stochastic indicator, trading signals can be generated around trend turning points.
Advantage Analysis
The main advantages of this strategy are:
- Captures trend reversals and enables contrarian trading
- Utilizes the reversal characteristic of Stochastic indicator for trade signals
- Combines overbought/oversold areas to avoid false reversals
- Simple and clear logic, easy to implement
Risk Analysis
The main risks of this strategy are:
- Stochastic indicator prone to false reversals, causing incorrect signals
- Fails to filter market noise effectively, potentially over-trading
- Unable to determine trend direction, needs trend filter
- No effective stop loss control, can lead to large losses
Corresponding solutions:
- Combine with other indicators to filter false signals
- Adjust parameters properly to ensure stable reliable signals
- Use with trend indicators to avoid counter-trend trading
- Incorporate stop loss mechanism to limit max loss per trade
Optimization Directions
The strategy can be optimized from the following aspects:
- Adjust Stochastic parameters, optimize %K, %D periods
- Add moving averages etc to filter signals, improve quality
- Add trend judgment rules to avoid counter-trend trades
- Incorporate stop loss and take profit rules for robustness
- Optimize entry and exit logic to reduce trading frequency
- Test adaptability across products and timeframes
- Strategy ensemble, combine with other strategies
Conclusion
This strategy generates trading signals based on the crossover of the short and long lines of the Stochastic indicator, aiming to capture reversals for contrarian trading. The logic is simple and clear, easy to implement, but also has some flaws. Better results can be achieved through parameter tuning, indicator combinations, risk control etc. It is a short-term trading strategy suitable for high frequency trading.
/*backtest
start: 2022-12-08 00:00:00
end: 2023-12-14 00:00:00
period: 1d
basePeriod: 1h
exchanges: [{"eid":"Futures_Binance","currency":"BTC_USDT"}]
*/

//@version=2
////////////////////////////////////////////////////////////
//  Copyright by HPotter v1.0 11/01/2017
// This back testing strategy generates a long trade at the Open of the following - 1