概述
这是一个基于4条均线的金叉死叉策略。它使用两组快慢均线,当快速均线从下方向上突破慢速均线时产生买入信号,反之产生卖出信号。该策略可以有效捕捉中长线趋势,在震荡行情中实现盈利。
策略原理
该策略使用4条指数移动平均线(EMA),包括2条快速EMA和2条慢速EMA。快速EMA长度分别为9日线和21日线,用来捕捉短期趋势;慢速EMA长度分别为50日线和200日线,用来判断中长期趋势方向。
当快速9日线从下方向上突破50日线,并且21日线也从下方向上突破200日线时,产生买入信号,即快速EMA从下向上“金叉”慢速EMA。这表示短期和中期趋势均为上涨,适合建立多头仓位。
相反,当快速9日线从上方向下突破50日线,并且21日线也从上方向下突破200日线时,产生卖出信号,即快速EMA从上向下“死叉”慢速EMA。这表示短期和中期趋势均为下跌,适合平掉多头仓位或者建立空头仓位。
优势分析
这种4均线金叉死叉策略结合了多重时间维度分析,可以有效判断市场趋势,在震荡行情中获利。主要优势包括:
捕捉中长线趋势:快慢均线配合,可以有效判断短中长三个时间维度的趋势方向,减少假信号。
过滤震荡:EMA本身具有滤波作用,可以过滤正常市场噪音,避免被套。
实现盈利:及时捕捉金叉买入机会和死叉卖出机会,实现交易盈利。
参数可调:用户可以自由调整4条均线的参数,适应不同商品不同周期的特点。
策略可扩展:可以在该策略基础上引入其他指标进行组合,构建更加复杂的量化策略。
风险分析
这种4均线金叉死叉策略也存在一定的风险,主要包括:
假突破风险:市场可能出现假金叉和假死叉,策略产生的交易信号不可靠。可以通过调整均线参数或引入其它指标进行确认,降低假信号概率。
震荡风险:横盘和震荡行情中,该策略可能会产生更多交易信号,增加交易频率和手续费成本。可以设置适当的止损和止盈条件,控制每个交易的盈亏。
系统风险:该策略偏重技术分析,忽略了基本面分析。当公司业绩或宏观经济环境发生重大变化时,技术指标可能会失效。建议配合基本面研究使用该策略。
优化方向
这种4均线金叉死叉策略还存在进一步优化的空间,主要优化思路包括:
引入脚本自动优化参数:编写脚本程序,对策略中的4条EMA均线长度进行全面优化,寻找最优参数组合。
增加确认条件:在产生交易信号时增加额外确认指标,如交易量突增等,避免假信号。
结合季节性:根据不同期货品种的季节特点,调整策略参数,在具有明显季节性的品种中获利。
止损止盈设置:对每次交易设置合理的止损位和止盈位,控制单笔交易的最大损失。
策略组合:该策略可作为基础策略引入机器学习算法,与其它技术指标策略组合,构建复杂的量化策略。
总结
这是一个非常有效的4均线金叉死叉策略。它利用两组快慢均线交叉判断市场趋势方向,sellable产生交易信号。该策略捕捉中长线趋势的同时可过滤正常市场噪音。它还具有参数调整灵活、可扩展性强等优势。我们也分析了可能的风险点以及未来的优化方向。总的来说,这是一个可靠、可盈利的量化交易策略。
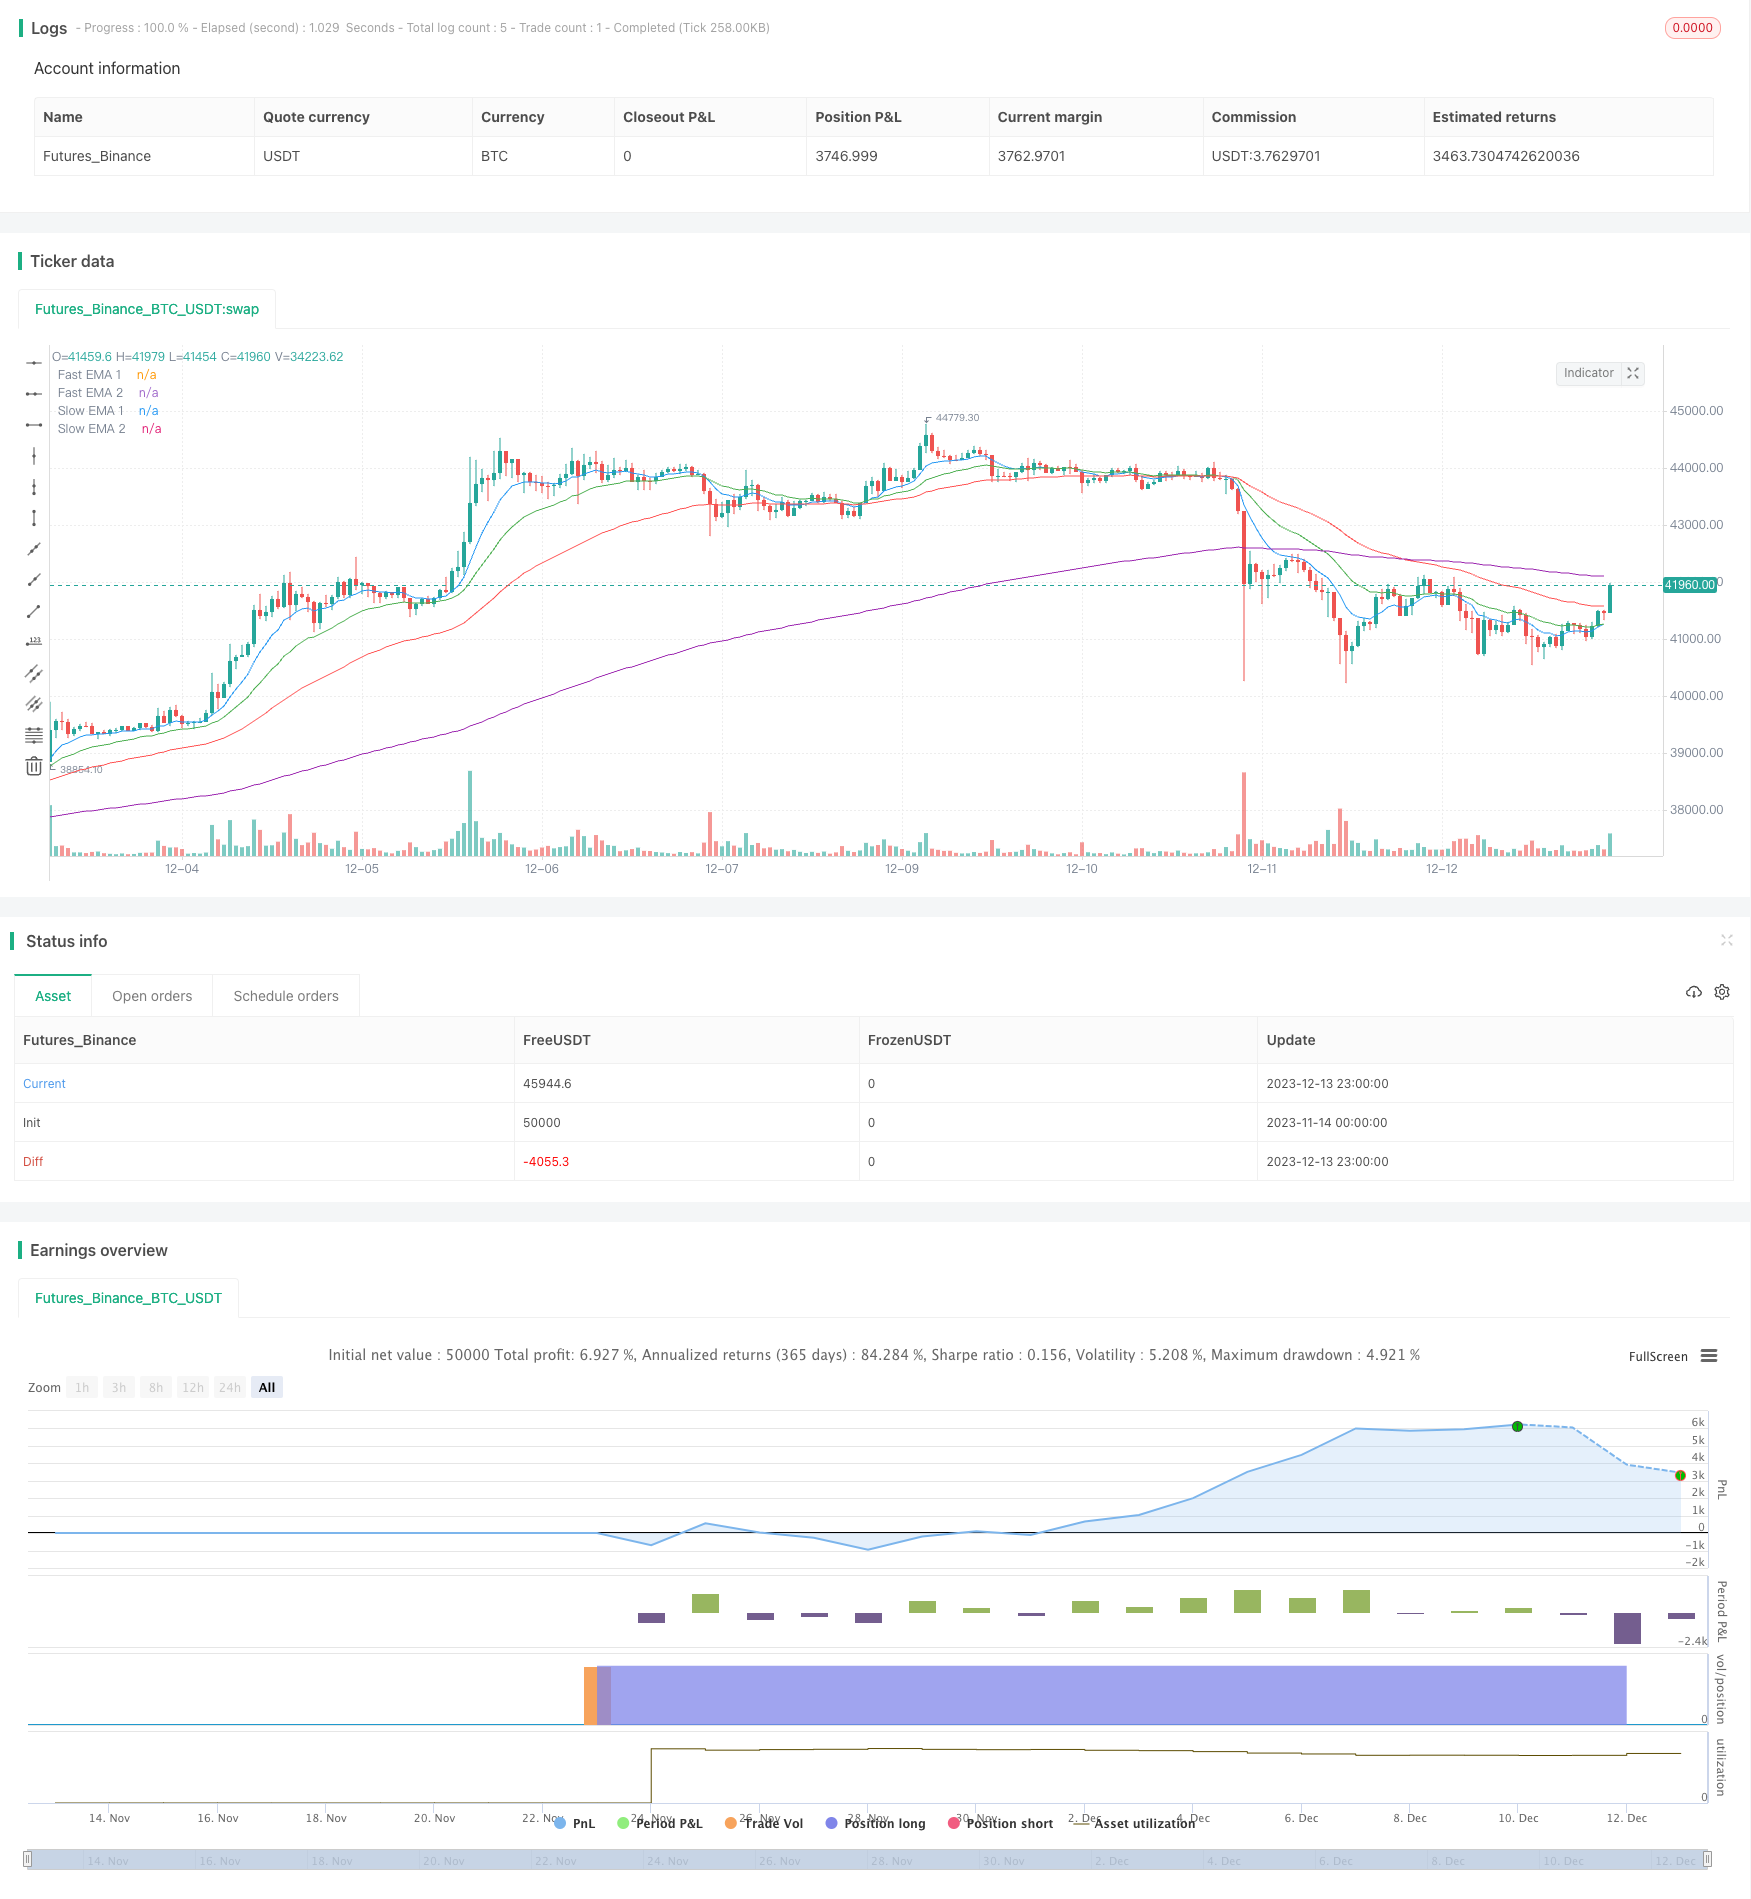
/*backtest
start: 2023-11-14 00:00:00
end: 2023-12-14 00:00:00
period: 1h
basePeriod: 15m
exchanges: [{"eid":"Futures_Binance","currency":"BTC_USDT"}]
*/

//@version=4
strategy("Four EMA Crossover", overlay=true)

// Input parameters
fast1Length = input(9, title="Fast EMA 1 Length")
fast2Length = input(21, title="Fast EMA 2 Length")
slow1Length = input(50, title="Slow EMA 1 Length")
slow2Length = input(200, title="Slow EMA 2 Length")

// Calculate EMAs
fastEMA1 = ema(close, fast1Length)
fastEMA2 = ema(close, fast2Length)
slowEMA1 = ema(close, slow1Length)
slowEMA2 = ema(close, slow2Length)

// Plot EMAs on the chart
plot(fastEMA1, color=color.blue, title="Fast EMA 1")
plot(fastEMA2, color=color.green, title="Fast EMA 2")
plot(slowEMA1, color=color.red, title="Slow EMA 1")
plot(slowEMA2, color=color.purple, title="Slow EMA 2")

// Strategy logic - Buy when fast EMA crosses above slow EMA and sell when fast EMA crosses below slow EMA
longCondition = crossover(fastEMA1, slowEMA1) and crossover(fastEMA2, slowEMA2)
shortCondition = crossunder(fastEMA1, slowEMA1) and crossunder(fastEMA2, slowEMA2)

strategy.entry("Long", strategy.long, when = longCondition)
strategy.entry("Short", strategy.short, when = shortCondition)

// Plot strategy entry points on the chart
plotshape(series=longCondition, title="Buy Signal", color=color.green, style=shape.triangleup, location=location.belowbar)
plotshape(series=shortCondition, title="Sell Signal", color=color.red, style=shape.triangledown, location=location.abovebar)