High Frequency Trading Strategy Based on Bollinger Bands and StochRSI Indicators

Strategy Overview
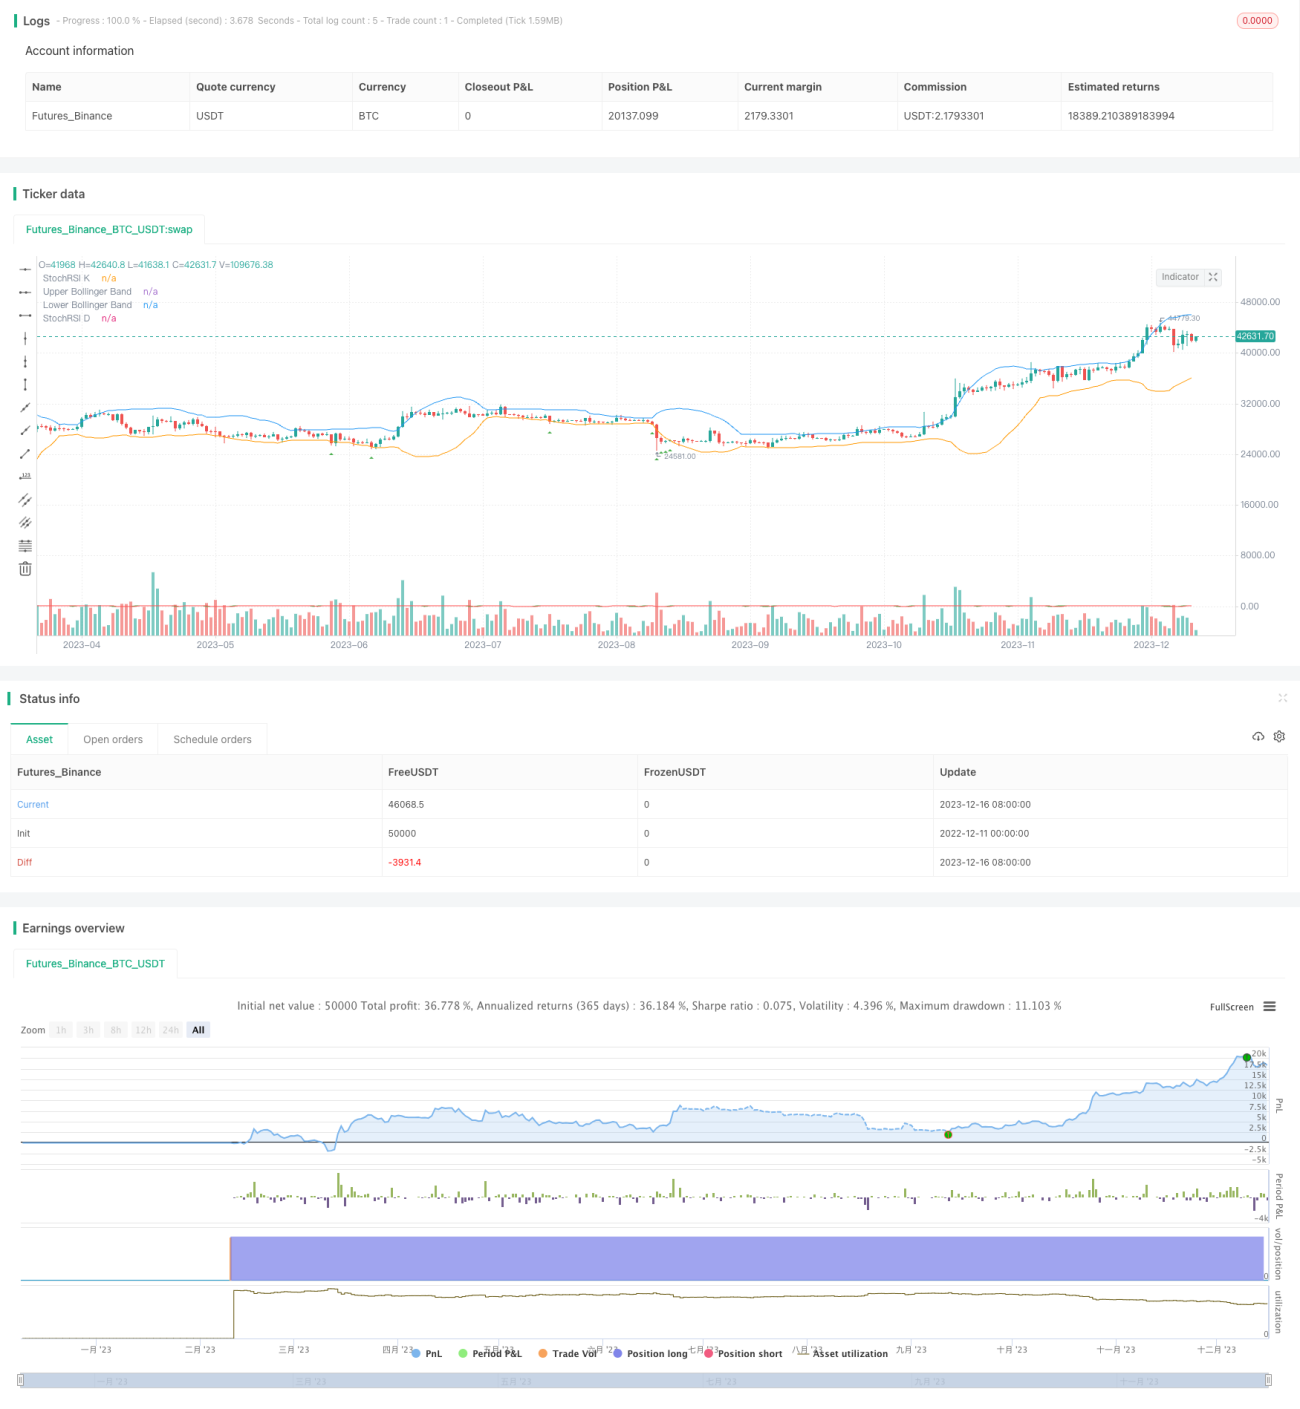
The strategy is named "Dual Indicator Leading Strategy". It is a long-only high frequency trading strategy that aims to generate frequent trading signals based on the Bollinger Bands and Stochastic RSI indicators. The strategy suits traders who pursue high trading frequency.
Strategy Logic
Indicator Calculation
Firstly, the Bollinger Bands upper band, middle band and lower band are calculated based on user-defined length and standard deviation parameters. The middle band represents the simple moving average of closing prices, while the upper and lower bands represent the standard deviation of price fluctuations.
Then, the Stochastic RSI indicator is computed based on chosen length, K period and D period parameters for StochRSI. This indicator combines the characteristics of RSI and Stochastics indicators to measure the momentum of asset prices.
Buy Condition
The buy condition triggers when the closing price falls below the Bollinger Bands lower band. This suggests that the price is in the lower range of its recent volatility and presents a potential buying opportunity.
Entry and Exit
When the buy condition is met, the strategy enters a long position for seeking opportunity.
The code does not include exit logic, which should be set by traders themselves based on product and timeframe for taking profits or stopping losses.
Advantage Analysis
- Utilizes Bollinger Bands to identify potential price reversal points
- StochRSI provides additional momentum judgment
- Achieves high-frequency trading suitable for scalping strategies
- Simplicity of only going long
- Flexibility to optimize parameters for better performance
Risk Analysis
- Risks of overbought and oversold conditions
- High trading frequency vulnerable to transaction costs
- Needs exit logic setting for profit taking or stopping losses
- Requires strict capital management
Risks can be reduced by adding two-way trading, parameter optimization, stop loss and take profit setting, evaluation of cost hedging etc.
Optimization Directions
- Add sell conditions to enable two-way trading
- Optimize parameter mix to reduce false signals
- Add trend indicator filters
- Set stop loss and take profit to ensure risk management
Conclusion
This strategy provides a framework for high frequency trading based on Bollinger Bands and StochRSI indicators. Traders can optimize the strategy by adjusting parameters, adding risk management measures etc. according to their trading goals and market conditions, in order to meet the needs of frequent trading.
//@version=5
strategy("High Frequency Strategy", overlay=true)

// Define your Bollinger Bands parameters
bollinger_length = input.int(20, title="Bollinger Bands Length")
bollinger_dev = input.float(2, title="Bollinger Bands Deviation")

// Calculate Bollinger Bands
sma = ta.sma(close, bollinger_length)
dev = bollinger_dev * ta.stdev(close, bollinger_length)

upper_band = sma + dev- 1