概述
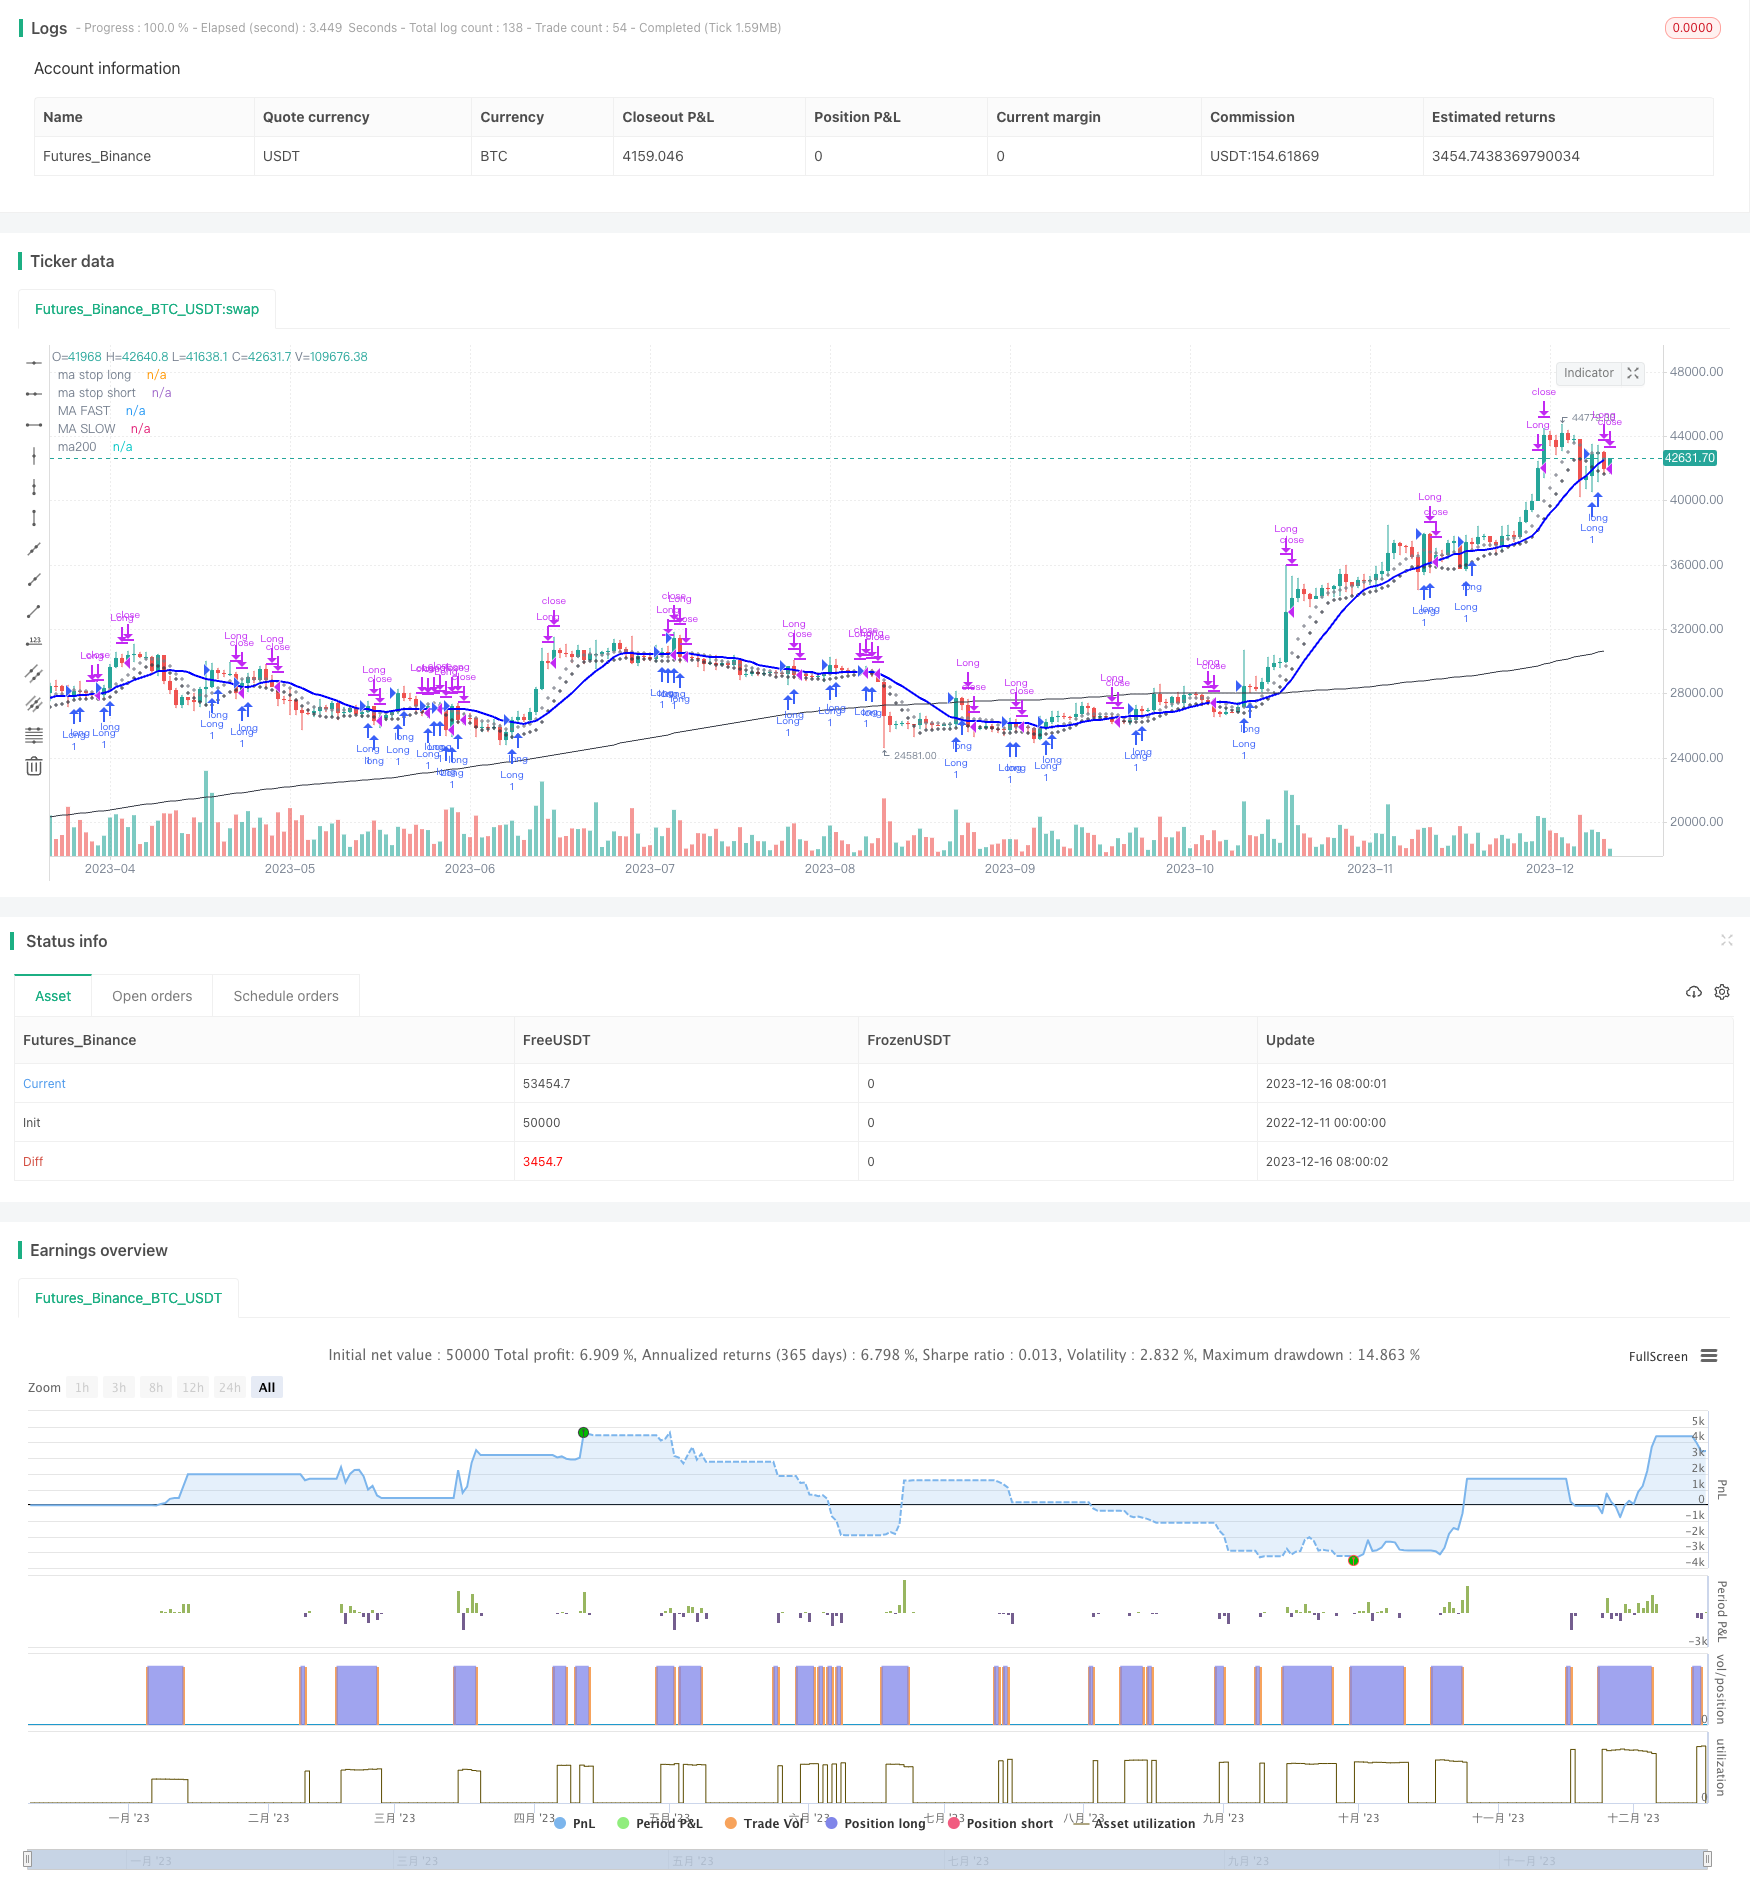
该策略是根据恩里科·马尔维尔蒂(Enrico Malverti)的文章改编而成,主要使用简单移动平均线(SMA)和相对强弱指标(RSI)来识别多头入场和平仓信号。策略只做多,不做空。
策略原理
入场信号是当收盘价上穿较长周期的SMA均线时开多仓。
平仓信号有以下几种: 1. RSI指标下破70或超过75时平仓; 2. 收盘价下破较短周期的SMA均线时止损; 3. 收盘价下穿较短周期的SMA均线时止盈。
同时绘制了止损的SMA均线和止盈的SMA均线。
优势分析
该策略具有以下优势:
- 使用了简单易懂的指标组合,容易理解和实现;
- 只做多,避免做空的额外风险;
- 有清晰的入场规则、止损规则和止盈规则,风险可控;
- 比较容易优化,可调整SMA周期等参数。
风险分析
该策略也存在一些风险:
- 容易产生多次损失后不再有信心追踪信号的心理阴影;
- SMA均线产生错位可能导致风险;
- RSI指标容易发散,超买超卖信号可能不可靠。
对应方法:
1. 建立一个固定的追踪机制,不受心理影响;
2. 调整SMA均线的参数,优化周期;
3. 结合其他指标过滤RSI信号。
优化方向
该策略还可以从以下几个方向进行优化:
- 尝试不同参数的SMA设置;
- 增加其他指标过滤入场和出场信号;
- 增加趋势判断指标,区分趋势和盘整;
- 尝试参数自适应优化。
总结
该策略整体思路清晰易懂,使用基本指标,可控性较强,适合中长线操作。但参数设置和指标过滤都需要反复测试和优化,才能使策略更加稳定可靠。思路简单的策略也需要大量优化调整和丰富组合才能形成真正可用的交易系统。
策略源码
/*backtest
start: 2022-12-11 00:00:00
end: 2023-12-17 00:00:00
period: 1d
basePeriod: 1h
exchanges: [{"eid":"Futures_Binance","currency":"BTC_USDT"}]
*/

//@version= 4
// form the original idea of Enrico Malverti www.enricomalverti.com , trading system 2015
// https://sauciusfinance.altervista.org
strategy(title="MAs & RSI strategy long only", overlay = true, max_bars_back=500)

///********FROM EMAS TO SIMPLE MA *****
// NON AGGIUNTO SCHAFF INDICATOR, che serve per discriminare quali titoli scegliere dallo screener (segnale già aperto o il primo o, a parità,
//quello più alto) ==> Tolte le bande di Bollinger (che filtrano "poco")

// INPUTS
emapf = input(14, title ="Ma periodo veloce",  minval=1, step = 1)
emapl = input(14, title ="Ma periodo lungo",  minval=1, step = 1)
emaps = input(7, title ="Ma periodi stop",  minval=1, step = 1)
rsi_period = input(14, title="RSI period", minval = 1, step = 1)
// CALCULATIONS
maf = sma(close, emapf)
mal = sma(close, emapl)
// rsi
myrsi = rsi(close, rsi_period)
//ema stop long ed ema stop short
//Ema7 messo da "massimo" a "chiusura" come target per posizioni short. Il limite è, in questo caso, sempre ema20 (più restringente - asimmetria)
// in questo t.s., lo short viene soltanto indicato come "rappresentazione grafica", non agito
mass = sma(close, emaps)
masl = sma(low, emaps)
ma200=sma(close,200)
/// Entry
strategy.entry("Long", true, when = crossover(close,mal))

rsi1 = crossunder(myrsi,70)
rsi2 = myrsi > 75
// previously, 80
st_loss_long = crossunder(close,masl)// **chiusura sotto EMA7**
target_long= crossunder(close,maf) //* Chiusura sotto EMA14*
// exits. *RSI**Long: Target if over bandamax, loss if under bandamin. Viceversa, for short
strategy.close("Long", when = rsi1, comment="crossunder RSI")
strategy.close("Long", when = rsi2, comment ="RSI MAX")
strategy.close("Long", when = st_loss_long, comment = "Stop loss")
strategy.close("Long", when = target_long, comment = "target_long" )

plot(masl, title="ma stop long", color=#363A45, linewidth= 1, style=plot.style_cross)
plot(maf, title="MA FAST", color=#FF0000,  linewidth= 1)
plot(mal, title="MA SLOW", color=#0000FF,  linewidth= 2)
plot(mass, title="ma stop short", color=#787B86,linewidth= 1, style=plot.style_cross)
plot(ma200, title="ma200", color=color.black,  linewidth= 1)