Adaptive SMI Ergodic Trading Strategy Based on Adaptive Exponential Moving Average Lines

Overview
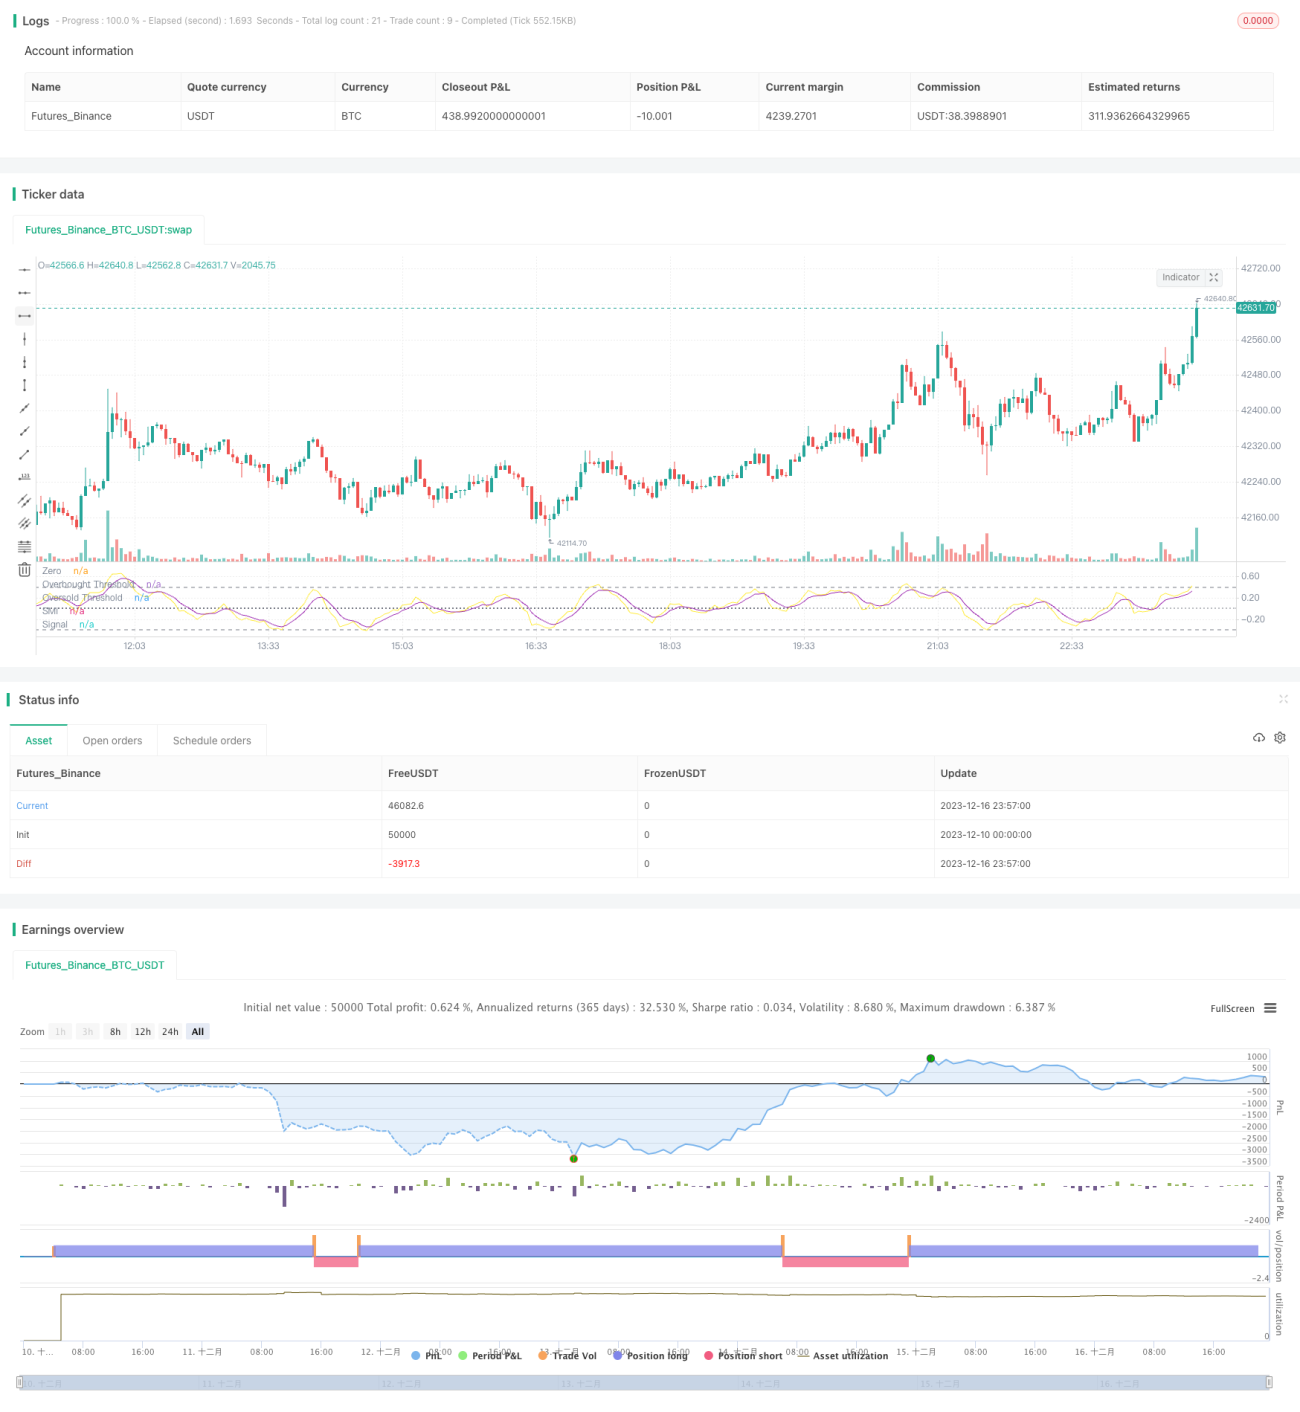
This article will conduct an in-depth analysis of a quantitative trading strategy based on Adaptive Exponential Moving Average (AEMA) lines. The strategy leverages the ergodic form of the Stochastic Momentum Index (SMI) indicator, together with an Exponential Moving Average serving as the signal line, and incorporates customizable overbought/oversold thresholds to improve the probability of successful trade execution.
Strategy Principle
The strategy uses two SMIs of different lengths, one short and one long, and the difference in span between them generates trading signals. In addition, the strategy also utilizes an Exponential Moving Average as the signal line. It goes long when the shorter period SMI crosses above the longer period SMA, and goes short when the opposite happens. To filter out false signals, long entry signals only appear when the SMI is below the oversold line and the signal line is also below the oversold line; short entry signals require the SMI to be above the overbought line and the signal line also above the overbought line. This dual condition setup makes the strategy more sensitive to sudden events, while also effectively avoiding false breakouts.
Advantages
The biggest advantage of this strategy lies in its adaptability. The strategy uses customizable overbought/oversold thresholds to dynamically adjust long and short criteria according to different market environments. This mechanism allows the strategy parameters to be optimized and adapted to a wider range of market conditions. In addition, the ergodic form of the SMI also enhances the sensitivity and timeliness of the strategy. Compared to the traditional SMI, it has higher noise reduction and smaller lag. This allows the strategy to respond quickly to sudden events and capture short-term trading opportunities.
Risks
The biggest risk of this strategy is its reliance on parameter settings. Improper parameter settings can easily generate a large number of invalid trading signals. In addition, as a pulse-type indicator, the SMI does not perform well in choppy random markets. The strategy can also easily get caught in violent trend reversal with extreme price fluctuations. To control these risks, it is recommended to adopt strict risk management measures while adjusting parameters to suit different market environments. Some feasible optimization directions will be proposed below.
Optimization Directions
There are still several optimizable aspects of the strategy. First, different combinations of SMA lengths can be tested to find the optimal parameter pair. Second, stop losses can be considered near entry points to control per trade loss. Third, other indicators like RSI and Bollinger Bands can be combined to set dynamic overbought/oversold lines. Fourth, parameters can be automatically optimized through machine learning algorithms. Fifth, the strategy can be integrated into multi-factor models to improve stability.
Conclusion
This article has conducted an in-depth analysis of the principle, advantages, risks and optimization directions of an adaptive SMI ergodic trading strategy. Through the use of adaptive thresholds and signal filtering with exponential moving averages, the strategy can effectively capture short-term market opportunities. Despite certain parameter dependence, with stringent risk control and multi-dimensional optimizations, the strategy still possesses considerable practical value. It is believed that this strategy can play an important role in quantitative trading practices, providing effective support for trading decisions.
- 1