AC Backtest Strategy of Williams Indicator

Overview
This strategy is based on the Awesome Oscillator (AO) in the Williams Indicator designed by famous trader Bill Williams. By calculating the difference between median price SMAs of different periods, it forms an oscillating indicator to diagnose trends and market momentum and designs corresponding trading signals to guide long and short.
Principle
The core indicator of this strategy is the Awesome Oscillator (AO), which is calculated as:
AO = SMA(Median Price, 5 days) - SMA(Median Price, 34 days)
Where the Median Price is defined as (Highest Price + Lowest Price)/2. This formula extracts price momentum information from two SMAs of the median price over different periods. Buying signals are generated when the fast SMA (5 days) is higher than the slow SMA (34 days), and selling signals are generated when the fast SMA is lower than the slow SMA.
To filter erroneous signals, this strategy also applies a 5-day SMA operation on AO. A reverse mode is provided where reversing the long/short signals realizes different trading directions. When AO is higher than the previous value, it is considered a buying opportunity and marked as a blue bar. When AO is not higher than the previous value, it is considered a selling opportunity and marked as a red bar.
Advantages
- Using median price instead of close price reduces the impact of false breakouts on SMA and improves stability
- Fast and slow SMA combination sensitively captures market changes
- Double SMA filtering removes high frequency noise and improves signal quality
- Flexible parameter adjustment adapts to different market environments
- Intuitive bar display of trading points for easy judgment of operations
Risks and Solutions
- Evaluate market volatility frequency cautiously to prevent overfitting by adjusting parameters
- Multiple erroneous operations may occur in oscillating markets. Relax stop loss range properly or reduce position scale
- Unreliable backtest data, actual performance may differ from simulation. Suggest combining multi-leg actual trading and split batch positions
Optimization Directions
- Increase filters like trading volume to improve signal quality
- Incorporate stop loss strategies to control individual operation losses
- Optimize position management, add or reduce positions according to market volatility
- Combine other indicators to determine trend direction to prevent oscillation reversals
Conclusion
This strategy utilizes the Awesome Oscillator designed with fast and slow median price SMA structure to diagnose market momentum changes, with intuitive and clear trading signals. But it is subject to impacts of oscillation and reversal, requiring proper parameter tuning and stop loss strategies to improve stability. With effective risk control, this strategy is simple, practical and worth further optimization and application.
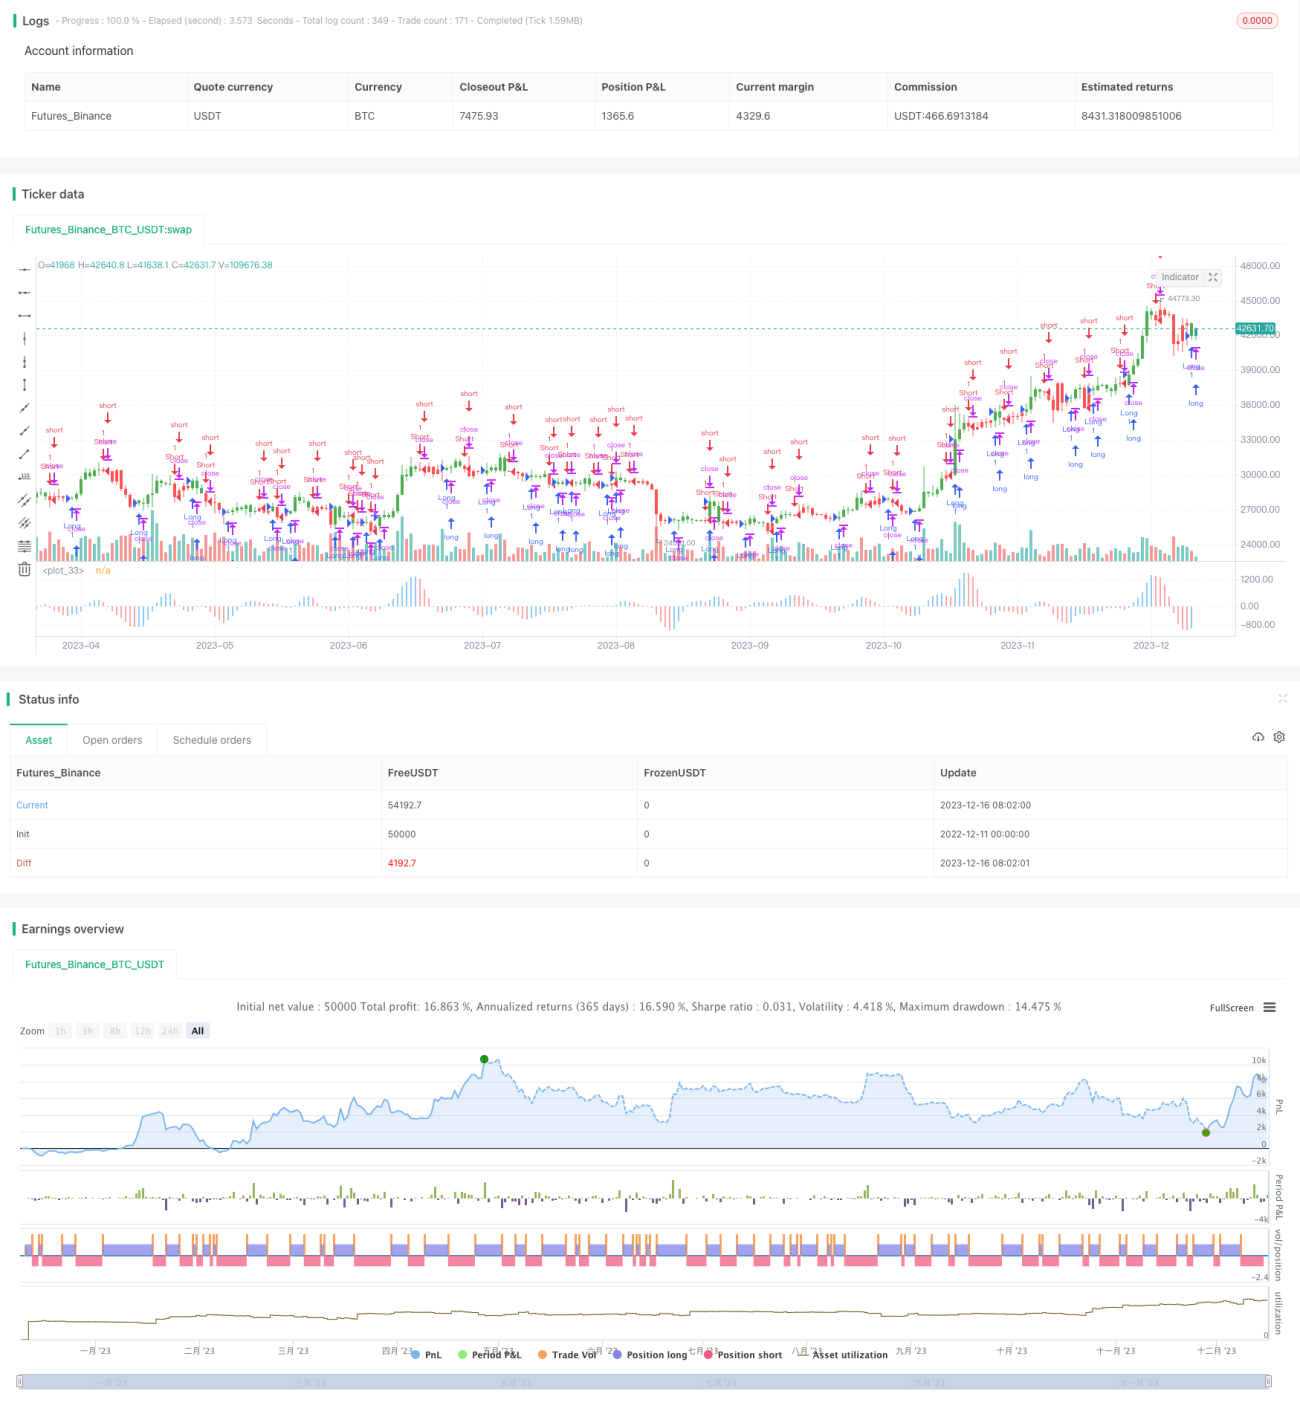
/*backtest
start: 2022-12-11 00:00:00
end: 2023-12-17 00:00:00
period: 1d
basePeriod: 1h
exchanges: [{"eid":"Futures_Binance","currency":"BTC_USDT"}]
*/

//@version=2
////////////////////////////////////////////////////////////
//  Copyright by HPotter v1.0 28/12/2016
// This indicator plots the oscillator as a histogram where blue denotes - 1