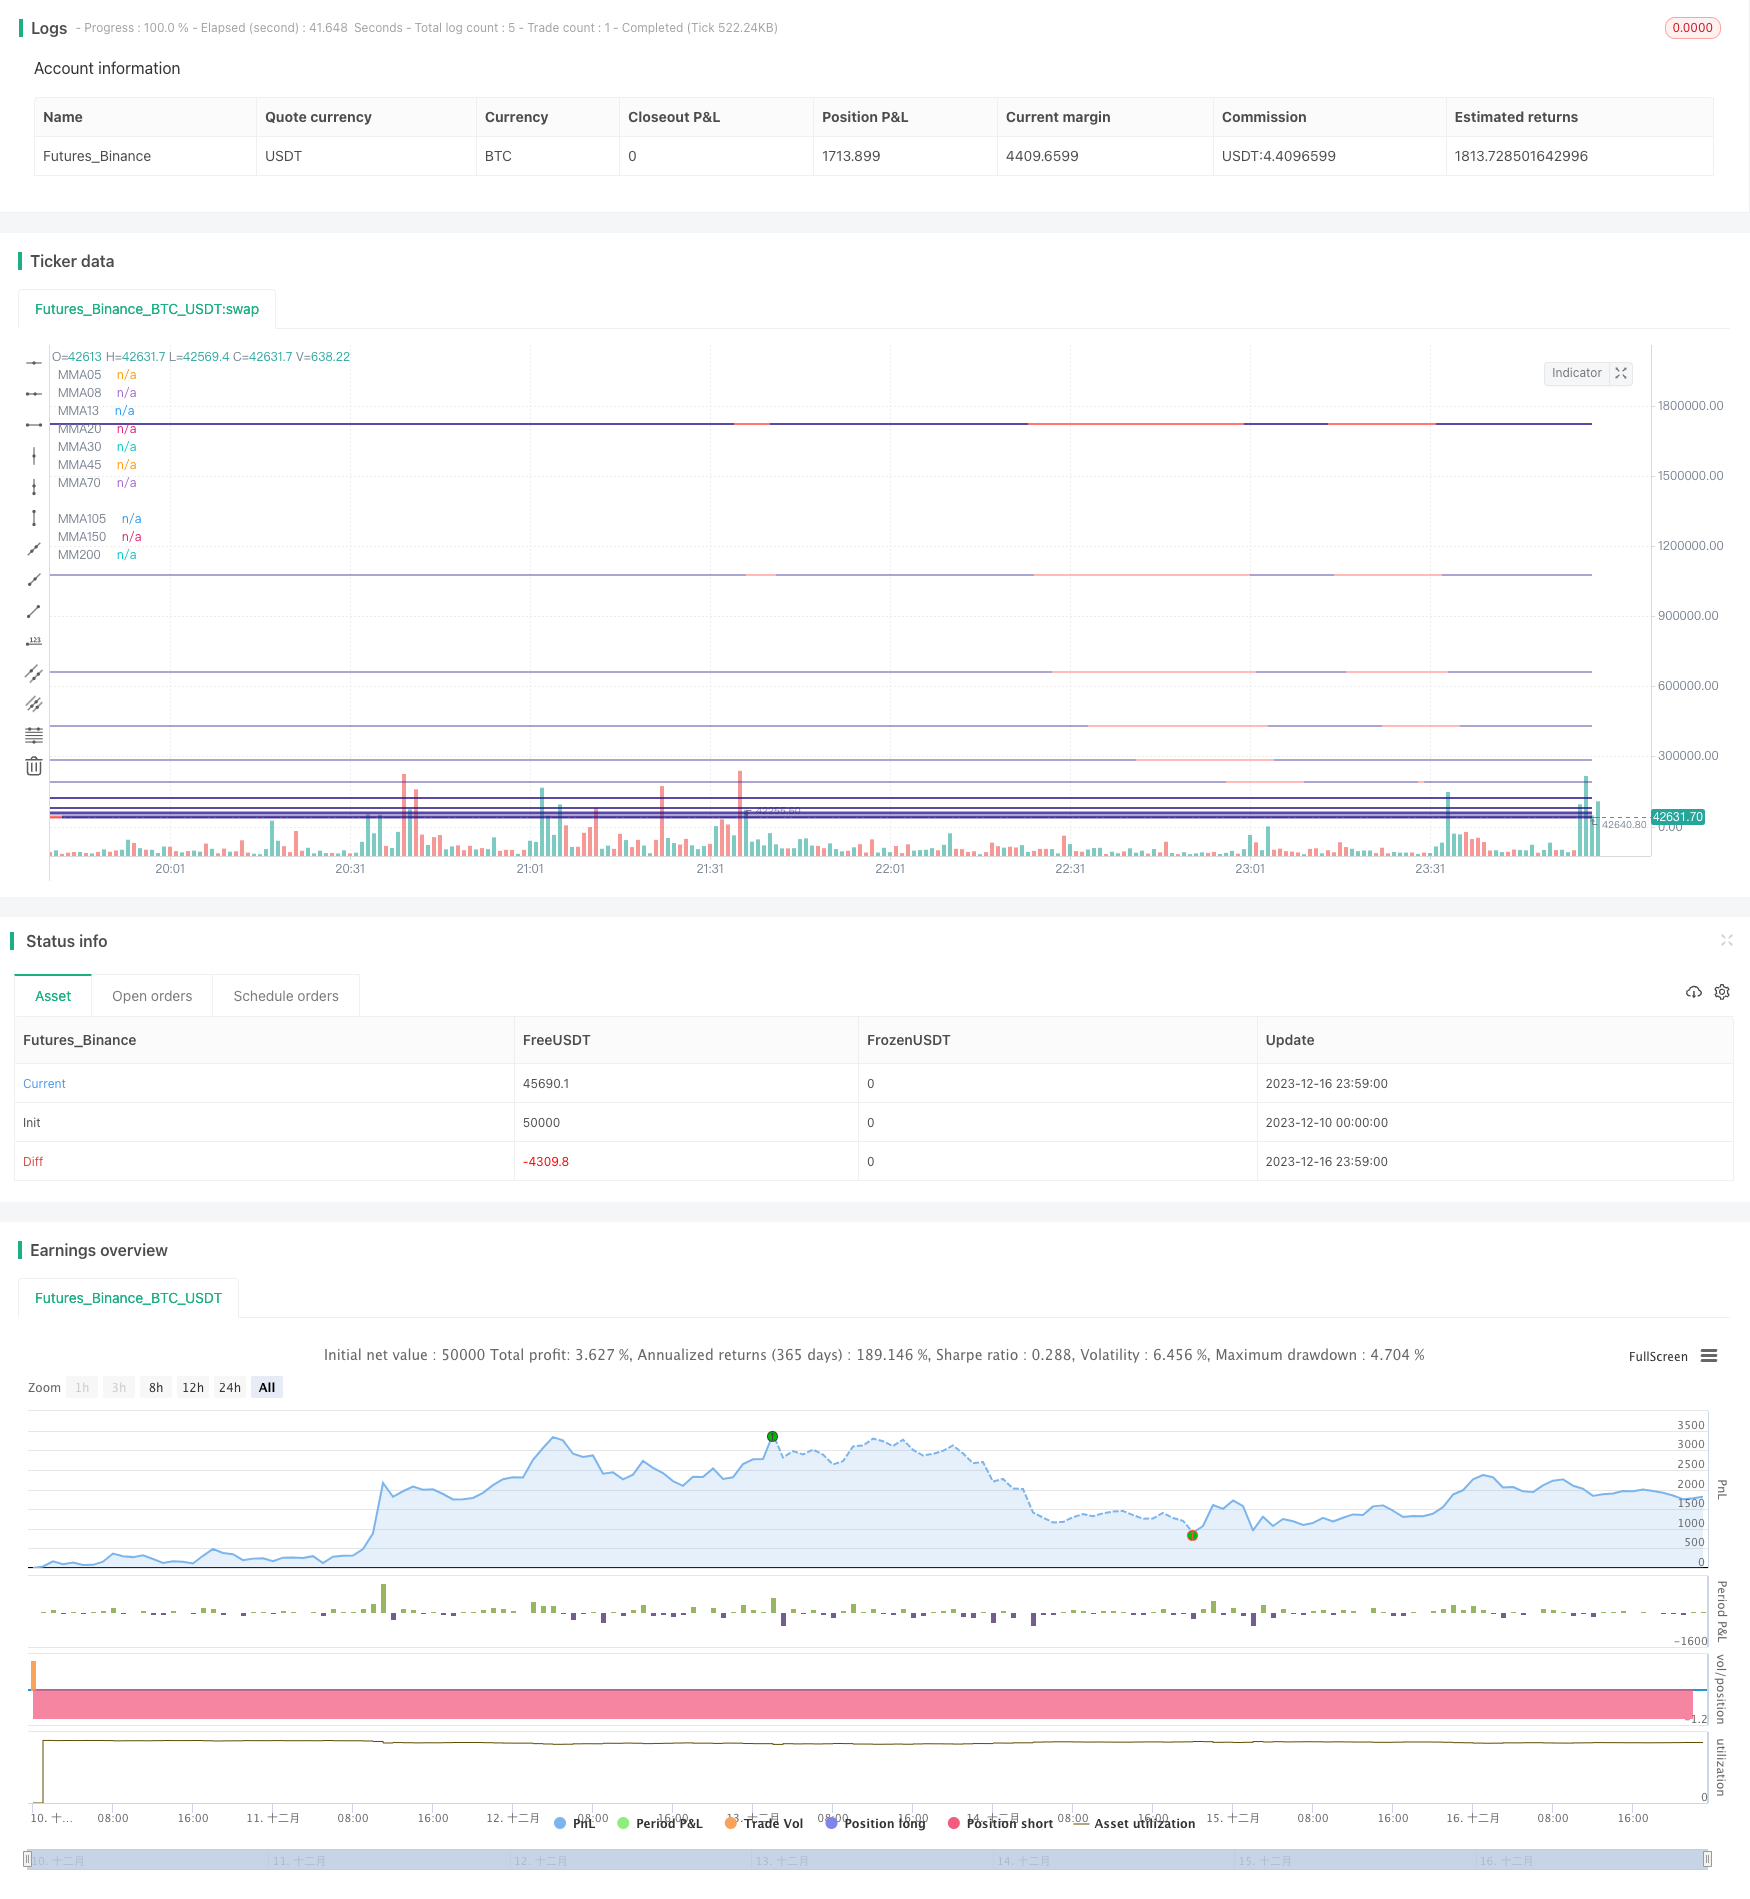
概述
移动平均带策略是一种基于多个移动平均线的趋势跟踪策略。它会同时监控快速移动平均线和慢速移动平均线,当价格突破移动平均带时产生交易信号。该策略同时结合了趋势判断和超买超卖指标,可以有效地捕捉中长线趋势。
策略原理
该策略同时使用 5 个快速移动平均线(5日线、8日线、13日线、20日线和 30日线)和 4 个慢速移动平均线(45日线、70日线、105日线和 150日线),快速线组成内部的移动平均带,慢速线组成外部的移动平均带。当价格上穿内部平均带时产生买入信号,当价格下穿内部平均带时产生卖出信号。为了过滤假突破,它要求价格需要连续 3 根K线突破内部移动平均带,并且大部分快速移动平均线也同步突破,才会产生交易信号。
此外,该策略还会判断长期趋势。只有当价格处于 200 日移动平均线之上,才会考虑产生买入信号。反之,只有价格跌破 200 日移动平均线,才会考虑产生卖出信号。通过判断长期趋势,可以避免在盘整期间被套。
优势分析
该策略具有以下几个优势:
多重移动平均线设计,可以准确判断趋势方向。内外移动平均带结合快慢速均线,识别中长线趋势效果好。
连续突破机制可以有效过滤假突破。同时要求大部分快速均线突破,确保趋势变化。
判断长期趋势,避免在盘整中被套。配合 200 日线判断,只在趋势发生转折时才考虑建仓。
兼顾趋势跟踪和超买超卖。移动平均线本身具有趋势跟踪功能,又结合超买超卖指标设定止损点,风险控制到位。
风险分析
该策略主要存在以下风险:
突破失败风险。当价格出现假突破时,该策略无法完全避免亏损的产生。
震荡趋势下亏损风险。当行情长期震荡时,止损点可能会频繁被击中,导致亏损加大。
参数优化风险。移动平均线参数设置不当,也会导致交易信号产生误差,进而亏损加大。
对应解决方法:
适当放宽止损点,给予价格足够空间去运行。或者采用ljetrail 止损方式,让止损线随价格运行。
增加趋势判断指标,避免在震荡期无方向建仓。例如配合 DMI、MACD 等指标进行过滤。
借助历史回测和参数优化手段,选择最佳参数组合。实盘中也要跟踪参数效果,进行动态优化。
优化方向
该策略可以从以下几个维度进行优化:
优化移动平均线参数,选取最佳周期数。可以通过回测不同周期数的移动平均线,找到最佳参数组合。
增加趋势判断指标进行滤波。例如 RSI 指标判断超买超卖、布林带判断通道突破等。避免在趋势不明朗时盲目建仓。
采用自适应移动平均线。根据市场变化和波动率,实时优化移动平均线参数,使之更好地适应当前市场状态。
结合机器学习模型判断趋势概率。建立概率模型评估突破成功概率,助力决策系统判断入场时机。
优化止损策略,让止损更好跟踪价格。例如 traillig stop loss 或自动缩量止损等,让止损线更加智能。
总结
移动平均带策略是比较常见的趋势跟踪策略之一。它同时结合快速线和慢速线判断中长线趋势,并设定连续突破过滤机制来决定入场。该策略兼顾趋势跟踪和超买超卖判断,通过参数优化和指标增强,可以进一步提升运用效果。它适用于中长线持有的投资者。
//@version=4
strategy(title="Moving Average Ribbon", shorttitle="MA Ribbon", overlay=true)
src = input(close, type=input.source, title="Source")
matype = input(title="Input one in lowercase: sma, ema, wma, trima, zlema, dema, tema, or hma", type=input.string, defval="trima")
// possible values: sma, ema, wma, trima, zlema, dema, tema, hma (hull ma)


trima(_src, _len) =>
    sma(sma(_src, _len), _len)
hma(_src, _len) =>
    wma(2 * wma(_src, _len / 2) - wma(_src, _len), round(sqrt(_len)))
dema(_src, _len) =>
    2 * ema(_src, _len) - ema(ema(_src, _len), _len)
tema(_src, _len) =>
    3 * ema(_src, _len) - 3 * ema(ema(_src, _len), _len) +
       ema(ema(ema(_src, _len), _len), _len)
zlema(_src, _len) =>
    ema(_src, _len) + ema(_src, _len) - ema(ema(_src, _len), _len)

ma(_src, _len) =>
    hma__1 = hma(_src, _len)
    ema_1 = ema(_src, _len)
    sma_1 = sma(_src, _len)
    wma_1 = wma(_src, _len)
    trima__1 = trima(_src, _len)
    zlema__1 = zlema(_src, _len)
    dema__1 = dema(_src, _len)
    tema__1 = tema(_src, _len)
    matype == "hma" ? hma__1 : matype == "ema" ? ema_1 : matype == "sma" ? sma_1 :
       matype == "wma" ? wma_1 : matype == "trima" ? trima__1 :
       matype == "zlema" ? zlema__1 : matype == "dema" ? dema__1 : tema__1

ma05 = ma(src, 5)
ma08 = ma(src, 8)
ma13 = ma(src, 13)
ma20 = ma(src, 20)
ma30 = ma(src, 30)
ma45 = ma(src, 45)
ma70 = ma(src, 70)
ma105 = ma(src, 105)
ma150 = ma(src, 150)
ma200 = ma(src, 200)


maColor(ma, maRef) =>
    if change(ma) <= 0 and ma05 < maRef
        color.new(color.red, 20)
    else
        if change(ma) >= 0 and ma05 > maRef
            color.new(color.navy, 20)
        else
            if change(ma) < 0 and ma05 > maRef
                color.new(color.red, 20)
            else
                if change(ma) >= 0 and ma05 < maRef
                    color.new(color.navy, 20)
                else
                    color.gray


aboveConfirmed(x,maRef)=>
    above=true
    for i=1 to x
        if close[i]<maRef[i] and not (close[i]>ma200[i]*1.01) and not (ma05[i]>ma105[i]*1.015)
            above:=false
    above


aboveMost(x,len)=>
    above=0
    boolean=false
    if close[len]>ma05[len]
        above:=above+1
    if close[len]>ma08[len]
        above:=above+1
    if close[len]>ma13[len]
        above:=above+1
    if close[len]>ma20[len]
        above:=above+1
    if close[len]>ma30[len]
        above:=above+1
    if close[len]>ma45[len]
        above:=above+1
    if close[len]>ma70[len]
        above:=above+1
    if close[len]>ma105[len]
        above:=above+1
    if close[len]>ma150[len]
        above:=above+1
    if close[len]>ma200[len]
        above:=above+1
    if(above>=x)
        boolean:=true
    boolean

belowMost(x,len)=>
    above=0
    boolean=false
    if close[len]<ma05[len]
        above:=above+1
    if close[len]<ma08[len]
        above:=above+1
    if close[len]<ma13[len]
        above:=above+1
    if close[len]<ma20[len]
        above:=above+1
    if close[len]<ma30[len]
        above:=above+1
    if close[len]<ma45[len]
        above:=above+1
    if close[len]<ma70[len]
        above:=above+1
    if close[len]<ma105[len]
        above:=above+1
    if close[len]<ma150[len]
        above:=above+1
    if close[len]<ma200[len]
        above:=above+1
    if(above>=x)
        boolean:=true
    boolean


belowConfirmed(x,maRef)=>
    below=true
    for i=1 to x
        if close[i]>maRef[i] and not (close[i]<maRef[i]*0.99) and not (ma05[i]<ma105[i]*0.985)
            below:=false
    below


//plotshape(aboveConfirmed(5,ma150),color=color.navy,location=location.abovebar,style=shape.triangleup,size=size.large,title="above",text="above")

plot(ma05, color=maColor(ma05, ma150), style=plot.style_line, title="MMA05", linewidth=2)
plot(ma08, color=maColor(ma08, ma150), style=plot.style_line, title="MMA08", linewidth=1)
plot(ma13, color=maColor(ma13, ma150), style=plot.style_line, title="MMA13", linewidth=1)
plot(ma20, color=maColor(ma20, ma150), style=plot.style_line, title="MMA20", linewidth=1)
plot(ma30, color=maColor(ma30, ma150), style=plot.style_line, title="MMA30", linewidth=1)
plot(ma45, color=maColor(ma45, ma200), style=plot.style_line, title="MMA45", linewidth=1)
plot(ma70, color=maColor(ma70, ma200), style=plot.style_line, title="MMA70", linewidth=2)
plot(ma105, color=maColor(ma105, ma200), style=plot.style_line, title="MMA105", linewidth=2)
plot(ma150, color=maColor(ma150, ma200), style=plot.style_line, title="MMA150", linewidth=3)
plot(ma200, color=maColor(ma200, ma200), style=plot.style_line, title="MM200", linewidth=3)


closeLong=belowMost(6,1) and belowMost(6,2) and belowMost(6,3)
closeShort=aboveMost(6,1) and aboveMost(6,2) and aboveMost(6,3)

isAbove=aboveConfirmed(5,ma200)
strategy.entry("short", false, when=belowConfirmed(3,ma200) and belowMost(8,1) and belowMost(8,2) and belowMost(8,3))
strategy.entry("long", true, when=aboveConfirmed(3,ma200) and aboveMost(8,1) and aboveMost(8,2) and aboveMost(8,3))


strategy.close("long",when=closeLong)
strategy.close("short",when=closeShort)