Bollinger Bands Dual Standard Deviation Trading Strategy

Overview
This strategy is a trading strategy designed based on the Bollinger Bands dual standard deviation model. It uses the upper and lower rails of Bollinger Bands and one and two standard deviations as trading signals. It goes long when the price breaks through the upper rail and goes short when the price breaks through the lower rail. The strategy also uses one and two standard deviations as stop loss lines.
Strategy Logic
The strategy first calculates the middle rail, upper rail and lower rail of the Bollinger Bands. The middle rail is the SMA of CLOSE, the upper rail is middle rail + 2standard deviation, and the lower rail is middle rail - 2standard deviation. When the price breaks through the upper rail, a buy signal is generated to go long. When the price breaks through the lower rail, a sell signal is generated to go short. In addition, the strategy also plots the lines of middle rail + 1 standard deviation and middle rail - 1 standard deviation. They are used as stop loss lines. The specific logic is:
- Calculate the SMA of CLOSE as the middle rail of Bollinger Bands
- Calculate the standard deviation STD of CLOSE, and calculate 2*STD
- Middle rail + 2STD is the upper rail of Bollinger Bands, middle rail - 2STD is the lower rail
- Go long when price breaks through the upper rail
- Go short when price breaks through the lower rail
- Middle rail + 1*STD serves as the stop loss line. If the stop loss line is broken, close the position.
Advantages of the Strategy
- The dual standard deviation design makes the breakout judgment more strict to avoid wrong signals
- The dual stop loss lines design maximizes risk control
- Large parameter optimization space, the period of middle rail and the multiple of standard deviation can be adjusted
- The drawdown can be controlled by adjusting the stop loss level
Risks of the Strategy
- Bollinger Bands strategies are prone to false breakouts, leading to inaccurate trading signals
- The dual standard deviation and dual stop loss lines setting may be too strict, missing opportunities by filtering out too many signals
- Improper parameter settings may increase the risk of the strategy
- The drawdown control is not perfect enough to effectively control losses in extreme market conditions
Optimization Directions
- Consider combining other indicators to filter Bollinger Bands trading signals to avoid false breakouts
- Test different parameter settings and optimize parameters for better return/drawdown ratio
- Design dynamic stop loss mechanisms such as trailing stop loss or equity percentage stop loss
- Combine machine learning algorithms to automatically optimize parameters
Conclusion
In general, this strategy is a typical Bollinger Bands breakout strategy. It uses dual standard deviations to increase the strictness of signal judgment and adopts dual stop loss lines to actively control risks. The strategy has some parameter optimization space. By adjusting parameters like middle rail period and standard deviation multiplier, better strategy performance can be obtained. At the same time, the strategy also faces the common problem of false breakouts in Bollinger Bands strategies. In addition, there is room for further improvement and optimization in the stop loss mechanism.
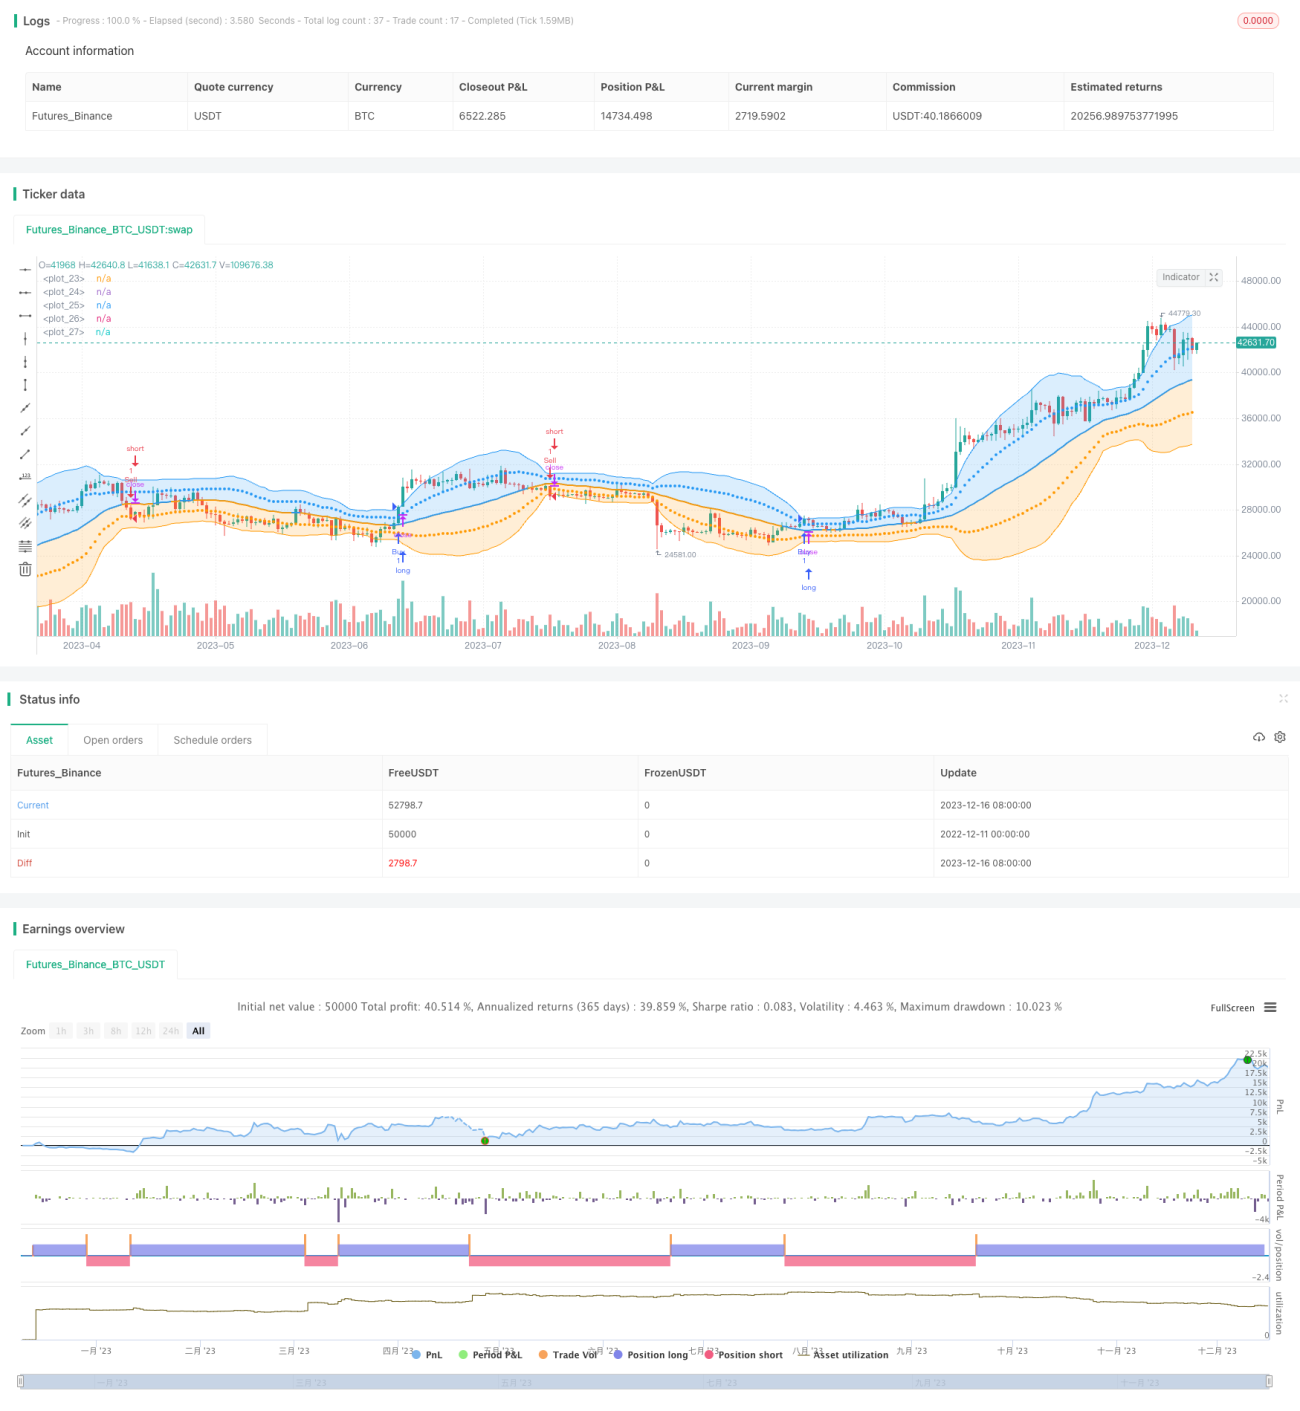
/*backtest
start: 2022-12-11 00:00:00
end: 2023-12-17 00:00:00
period: 1d
basePeriod: 1h
exchanges: [{"eid":"Futures_Binance","currency":"BTC_USDT"}]
*/

//@version=5
// Bollinger Bands: Madrid : 14/SEP/2014 11:07 : 2.0
// This displays the traditional Bollinger Bands, the difference is
// that the 1st and 2nd StdDev are outlined with two colors and two- 1